Summary: This article describes how to estimate the coverage with code review of code written by individual developers.
The article builds upon Estimating Coverage of Project’s Source Code with Code Review. As from version 2.6, Review Assistant, Devart’s code review tool, provides the new Code Coverage report.
Developed in response to numerous requests from our customers, the report serves for a better quality control over the code review process. Within the context of this article, we would like to show how to:
- Evaluate team performance in the code review process
- Evaluate individual developer’s performance
Disclaimer: From the very beginning I would like to clarify that the article uses the performance evaluation term. Yet no one should abuse it. Review Assistant provides a supplementary tool for evaluating the performance of software developers. And you have to be very careful while doing conclusions based on the reports.
Preparing Code Coverage Data for Analysis
For the demo purposes we will use the Code Coverage report provided by Review Assistant. As we have previously demonstrated, before analysing the data we need to weed out the “rubbish data” as described in Estimating Coverage of Project’s Source Code with Code Review.
Evaluating team’s performance in the code review process
After we filtered out irrelevant data, we can start the analysis. For example, let’s check what developers have most unreviewed code. To do this:
1. Group the report by the Status column. Right-click the header of the column and select Group By This Column from the popup menu
2. Similarly group the report by the Author column.
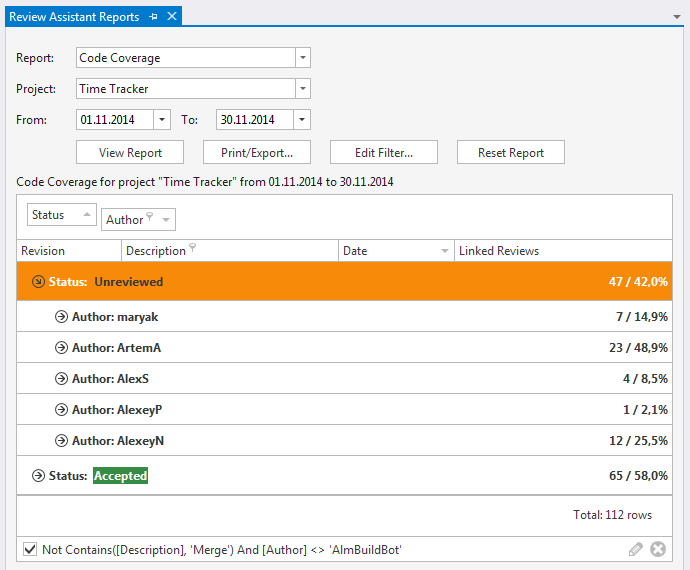
3. Right-click the header of any column and select Show Group Panel from the popup menu. The report should now look like on Figure 1.
We want to know whose code is least reviewed. For this, we need to take the next step.
4. On the group panel, right-click the Author column, and then select Sort By Summary in the popup menu.
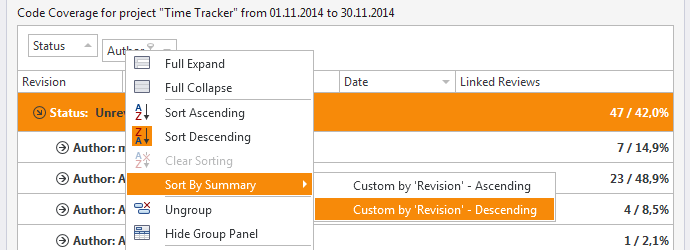
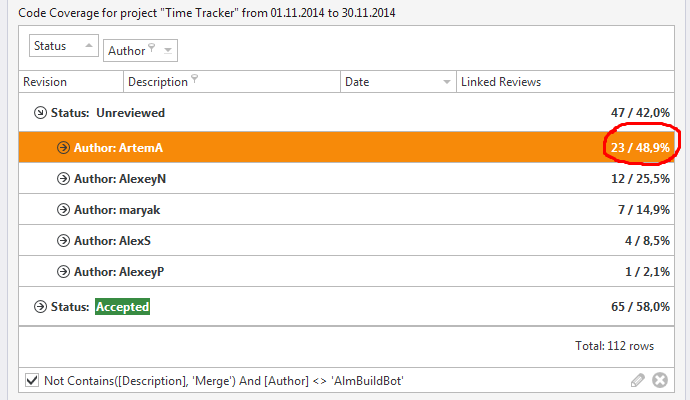
Now the report will be sorted within the group. After sorting, we can easily see (Figure 3), the largest number of unreviewed revisions. In this particular case, almost a half of that revisions is owned by a user named ArtemA.
Evaluating individual developer’s performance
Let’s have a look at a single developer. For this:
- Filter the report so that it only contains AlexeyN’s revisions. For more details read Estimating Coverage of Project’s Source Code with Code Review .
- Group the report by the Author column.
- Group the report by the Status column.
The report should now look like on Figure 4.
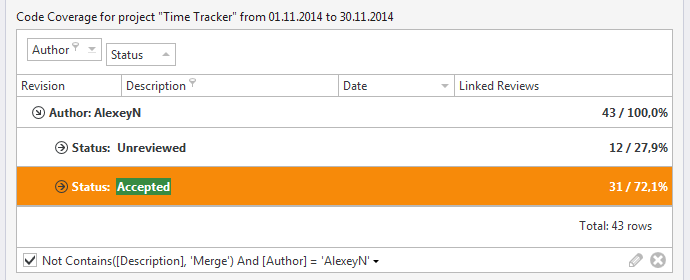
Looking at this report we can draw the following conclusions:
- The author made 2 commits at average during the work day (43 commits for 20 days on the November)
- 72% revisions reviewed (31 revisions from 43).
If we look at the Authors Statistics report for the same time-period, we can get an additional information.
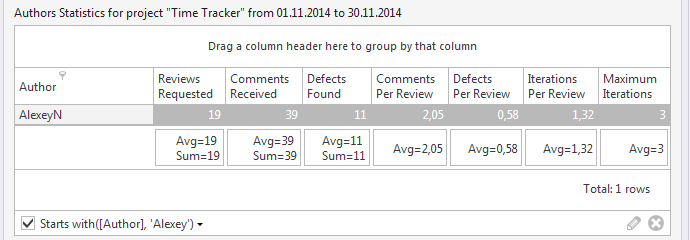
The report shows that AlexeyN:
- 19 times issued review requests
- Got 2 comments at average for every review.
- Had 1 defect for 2 reviews (1 defect rep 3 commits).
- We can conclude that there are 3-4 uncovered defects in those 12 revisions that were not reviewed.
Conclusion
We have reviewed the main features and benefits of the Code Coverage report, implemented in Devart’s code review tool, as well as the ways to analyze the code coverage report data. We hope it helps you improving control over code review process. Download Review Assistant and start reviewing code today.
