One of the best methods to analyze query performance is to explore its execution plan. In simple words, an execution plan is like a step-by-step plan one must follow to achieve the exact results they are looking for. Similarly, it is an ordered set of steps to access data in an SQL relational database management system. In this article, we are going to discuss the basics of the Query Execution Plan feature and its importance in SQL performance optimization with the help of a convenient IDE — dbForge Studio for SQL Server.
Contents
Key insights:
Further details:

Understanding execution plans
Imagine the situation when you have a good car and want to improve it by modifying its performance or appearance. In other words, you need a car tuning. You contact a particular service, and a mechanic looks at your car in its current condition and asks you what exactly you would like to change. They then give you an estimate of the work: approximately how long they think it will take the crew, what supplies will be needed, and the cost of those supplies. SQL Server provides you with a similar option. When you create a query, before committing to it, you can request an estimated execution plan.
Components of execution plans
To begin with, let us break down the structure of an execution plan into components. This will help us gain a better understanding of the matter and see the picture clearly both from micro and macro perspectives.
Execution plans typically consist of several key components:
- Operators: These represent the database system’s fundamental operations to retrieve and manipulate data. Examples include table scans, index scans, joins, sorts, and aggregations.
- Steps: Each operator in the execution plan corresponds to a step that outlines how the operation will be carried out. Steps provide detailed information, such as the tables involved, the type of operation performed, and any associated conditions.
- Estimated vs. Actual metrics: Execution plans often include estimates of the resources (such as CPU, memory, and disk I/O) required for each step based on statistics about the data distribution and database configuration. Additionally, actual execution metrics may be included to reflect the resources consumed during the query execution.
- Data flow: Execution plans illustrate the flow of data between different steps and operators. This helps visualize how data is processed and passed from one operation to the next, including any intermediate results generated along the way.
- Costs: Execution plans may also include cost estimates associated with each step, representing the relative expense of performing that operation compared to others. The database optimizer uses these costs to choose the most efficient plan for executing the query.
Estimated vs. actual execution plans
The estimated query execution plan is intended to show what SQL Server would most likely do if it were to execute the query.
SQL Server estimates the number of rows that may be returned from tables. It also decides what operators to use for data retrieval: Index Scan, which retrieves all the rows, and Index Seek, which retrieves only some. It decides what to use to join tables together: nested loops, merge joins, or hash joins. Eventually, you get the detailed plan of action that the SQL Server will implement while executing an SQL query.
You can get the estimated plan for a specific query, stored procedure, or function. The plan comes in three different formats: text, XML, and graphical. If you need the text or XML formats, use the following commands: SET SHOWPLAN_TEXT ON and SET SHOWPLAN_XML ON, respectively.
Once the query is executed, you can get the actual query execution plan. This plan provides exact information about how many reads the SQL Server performed, how many rows were read, and what joins were used.
There are some cases when SQL Server cannot create an estimated execution plan. For example, if you execute a query with parameters and the literal values are not passed in, the SQL Server is unable to create the estimated plan. If the query references a temporary table that is not declared, the execution plan also cannot be created.
The estimated execution plan can contain elements that are absent from the actual plan. For instance, the estimated plan shows a scalar-value function call, while the actual plan does not.
Generating execution plans
As we have already covered the basic theoretical points in the previous section, we can now move on to something more substantial: actually generating execution plans. dbForge Studio for SQL Server provides the Query Profiler tool to debug, troubleshoot, monitor, and measure your application’s SQL statements and stored procedures. We will be using it as a tool for today’s manipulations. And the AdventureWorks2022 database will be serving as our playground.
Let us select all people from the Person table where the first name is ‘Robin‘.
1. On the Start page, click Query Profiler. A new SQL document window opens.
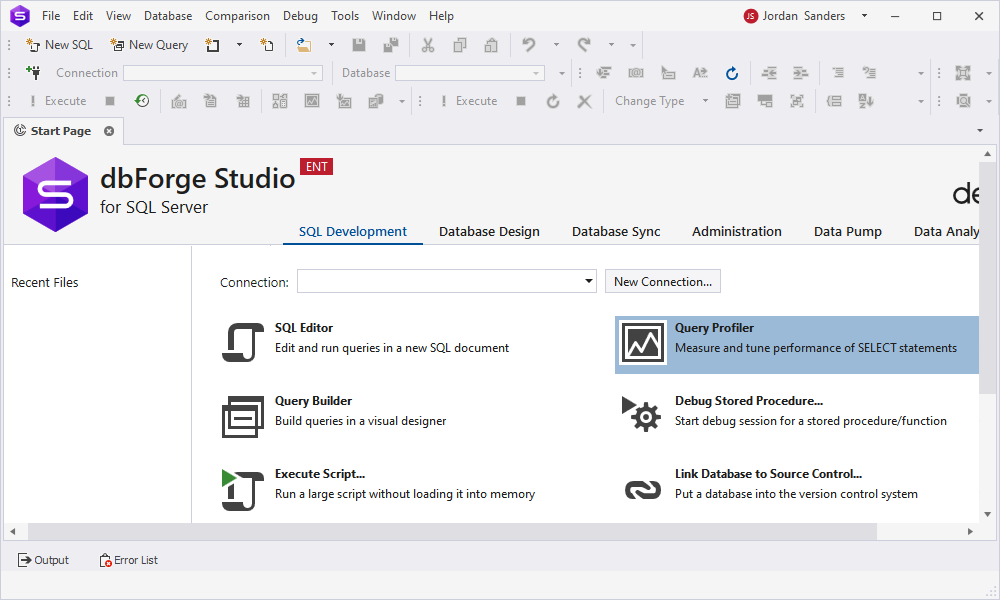
2. In the text editor, type the following script:
SELECT
  *
FROM AdventureWorks2022.Person.Person
WHERE FirstName = 'Robin';- Click Execute. The Plan Diagram window opens.
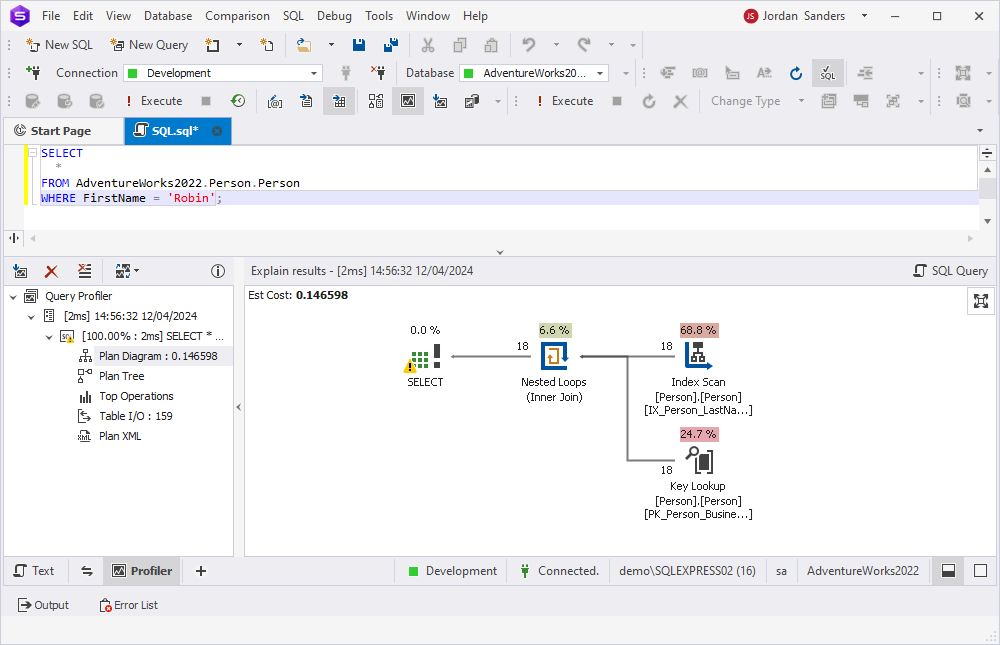
Note: The select icon contains an exclamation mark icon that warns about a shortcoming. When you pause the mouse pointer over the Select icon, a tooltip appears automatically. The bottom part of the tooltip contains a warning message that tells us that the index is missing.
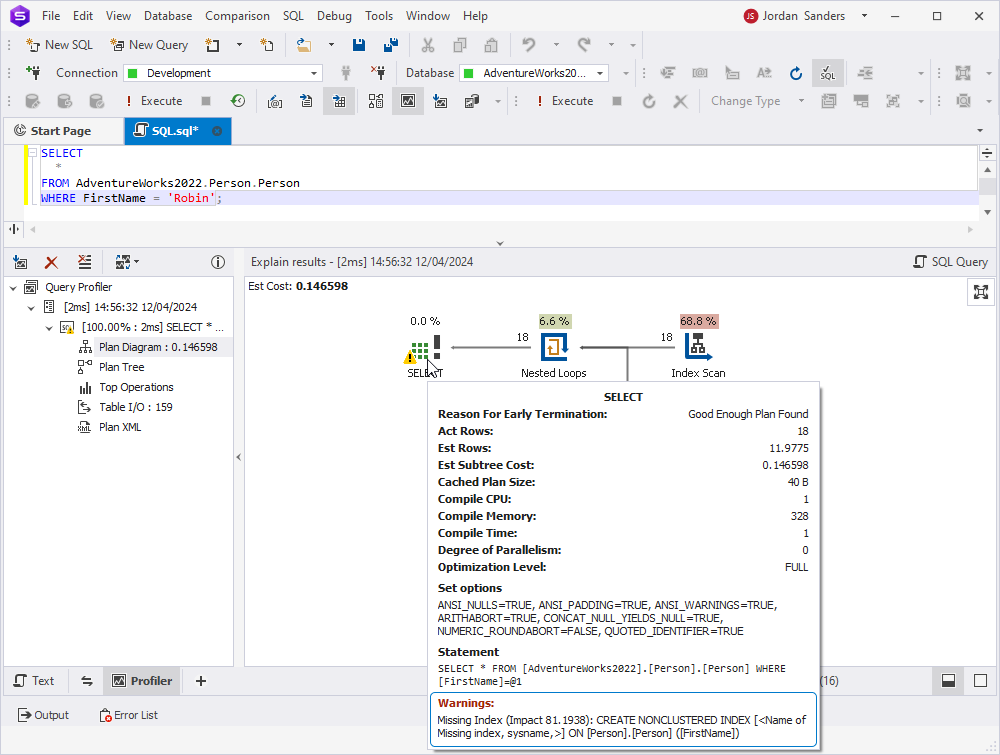
To add the index:
1. In Database Explorer, expand the Person table.
2. Right-click the Index folder, point to New Index, and then click Nonclustered Index. The Indexes tab of the Table editor opens.
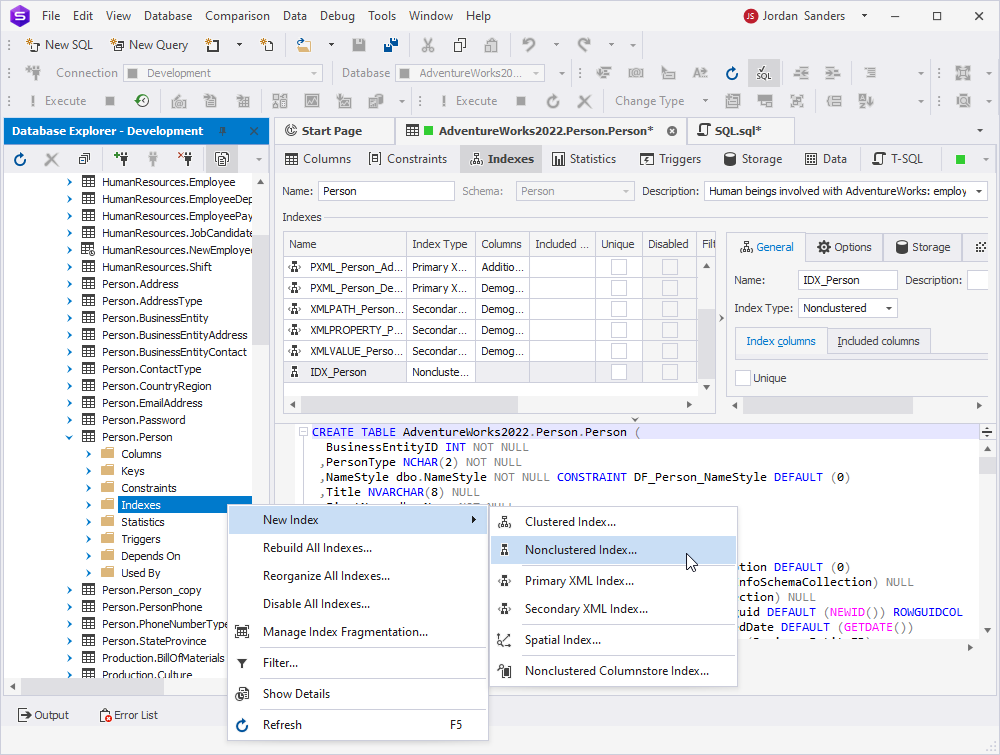
3. On the General tab of the Index Properties grid, navigate to the Index columns.
4. In the Name column of the Index key columns, select the FirstName column from the drop-down list box.
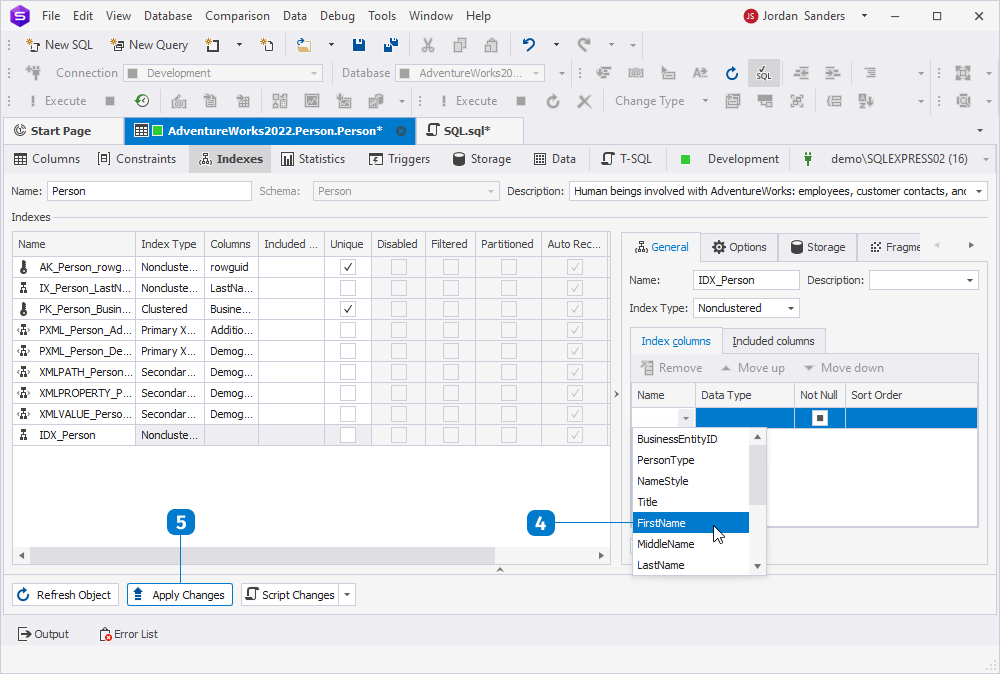
5. Click Apply Changes.
6. Now, we can get back to the Query Profiler and click Get New Results.
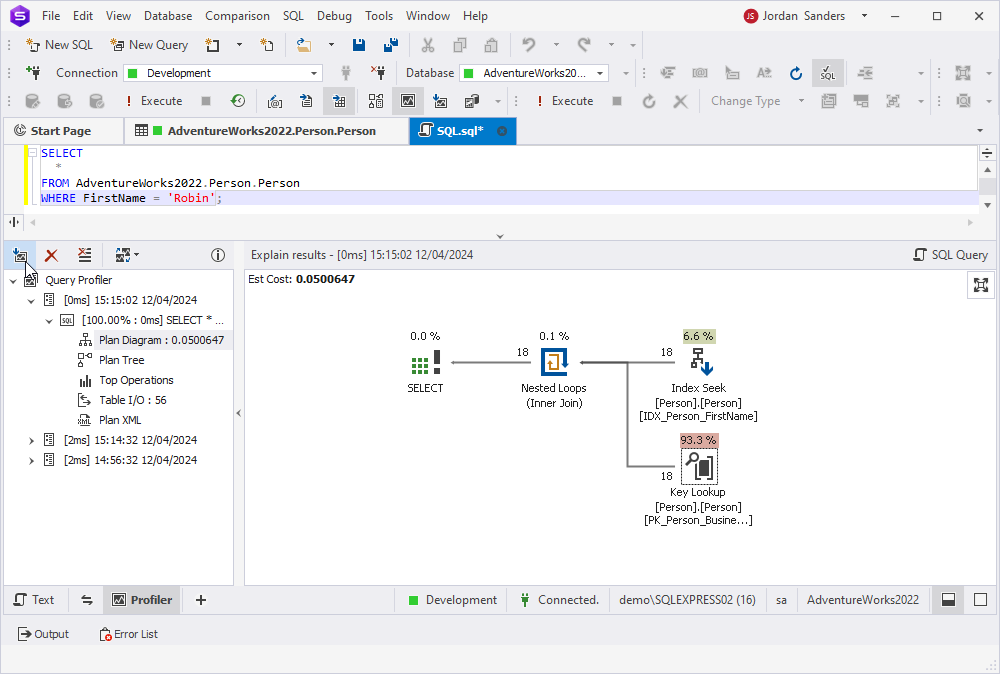
Each time you get profiling results for the executed query, they appear in the tree view as a new node with the time and date of query execution. When editing your query, you want to know whether your changes reduce query execution time. Query Profiler can quickly compare the profiling results. To compare results, hold the CTRL key and select both plan diagrams.
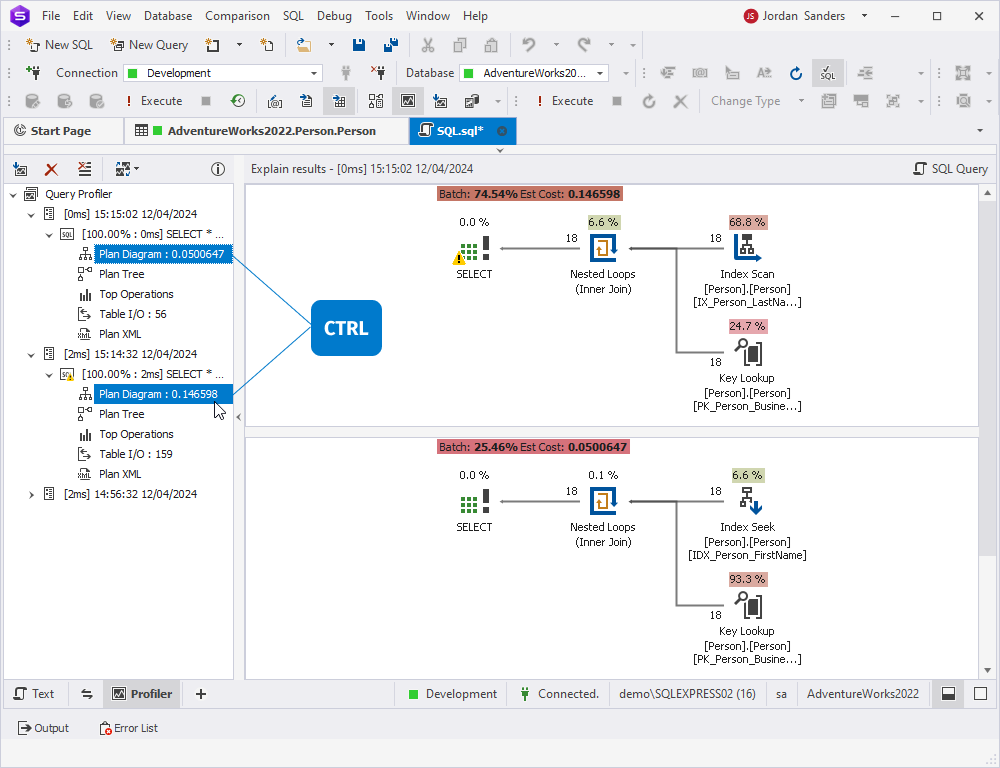
Note: When you save the query file after getting the query profiling results, they are automatically stored in the *.design file.
Tuning queries using execution plans
In the previous section, we reviewed how to generate an execution plan for a rather simple query that only requires a little optimization. Now, it is time to shift our attention to a more complex task. We are going to examine a rather poorly written query and work out a way to improve its performance with the help of dbForge Studio.
Just like before, open the Query Profiler. Then, execute the query below:
DECLARE @Name NVARCHAR(50)
SET @Name = 'll Crankarm'
SELECT
  Name
 ,ProductNumber
 ,ListPrice
 ,SafetyStockLevel
FROM Production.Product
WHERE SafetyStockLevel > 500
UNION ALL
SELECT
  Name
 ,ProductNumber
 ,ListPrice
 ,SafetyStockLevel
FROM Production.Product
WHERE UPPER(Name) = UPPER(@Name);
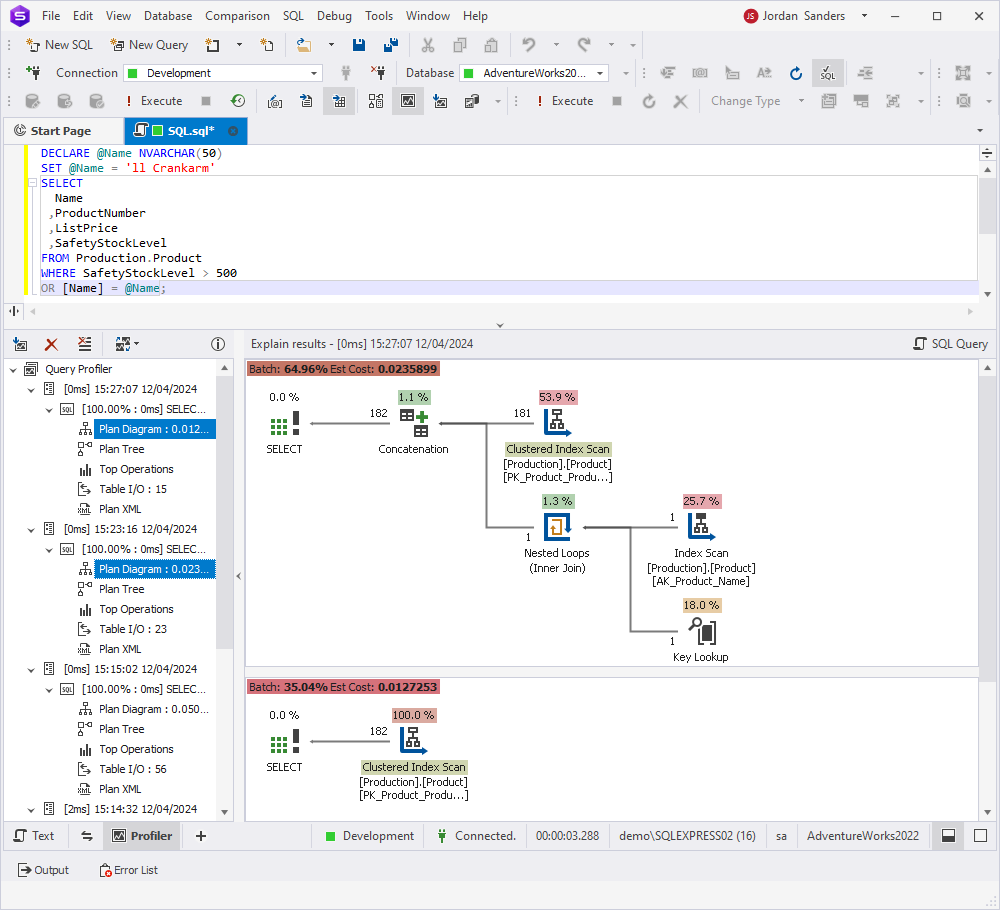
The Plan Diagram window opens:
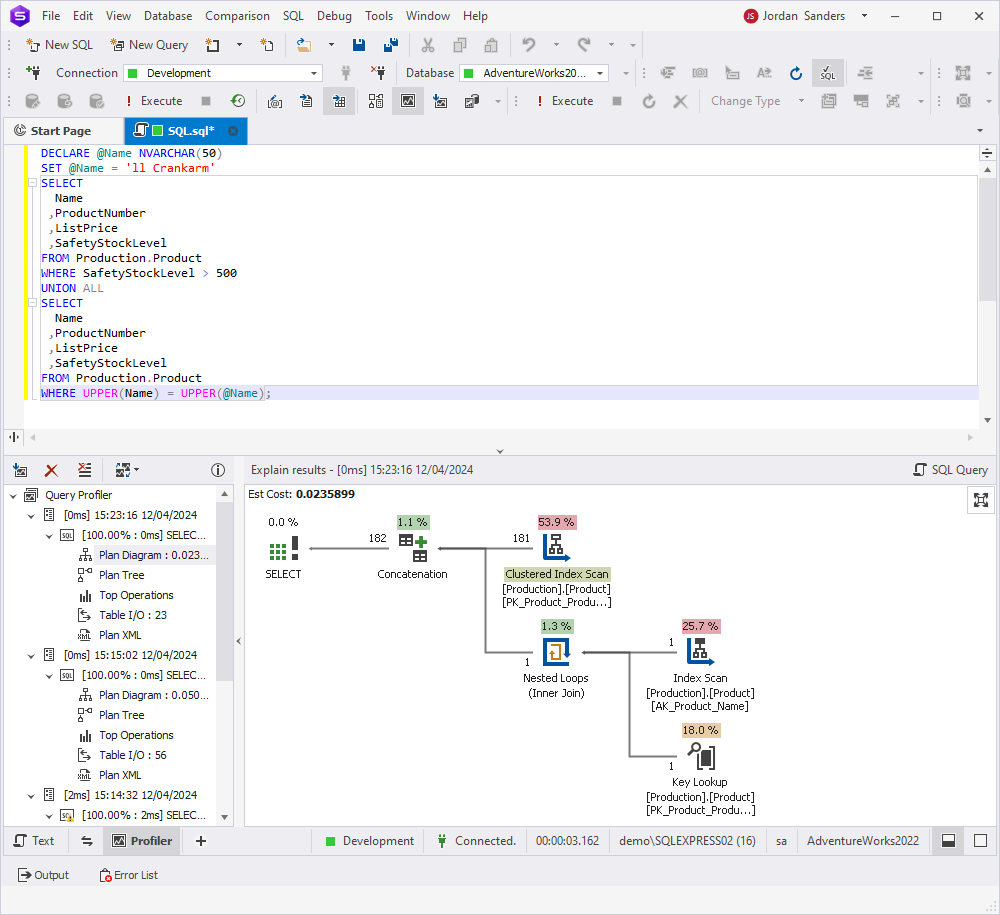
According to the plan, SQL Server will first perform a clustered index scan to query the Production.Product table. This query was identified as poorly performing, so we need to modify it.
We can get rid of UNION ALL and the UPPER function since we are querying the case-insensitive database.
As you can see, the second plan involves a single clustered index scan on the Production Product table. Thus, we utilize fewer resources while performing only one scan.
Advanced topics in execution plans
Query Profiler is a query optimization tool that can help you not only with basic SQL query performance optimization but also resolve more advanced tasks. It allows you to track the differences in profiling results when executing the query several times. With the tool, you can detect slow-running queries, examine the workload, and analyze bottlenecks to resolve performance issues in SQL databases. Profiling can also be used to determine queries’ unexpected behavior and much more:
| Query analysis and optimization | Profiling helps analyze the performance of complex queries by providing detailed insights into their execution plans. This way, developers can identify inefficiencies, such as missing or inefficient indexes, suboptimal join strategies, or excessive resource consumption, and optimize the queries accordingly. |
| Visual representation | It is easier to comprehend and interpret complex query execution logic in a visual format. This visual representation helps developers identify areas for optimization more effectively. |
| Stored procedure and function profiling | Query Profiler supports profiling of stored procedures and functions. This allows for a thorough analysis of their execution plans and performance metrics. Identify performance limitations, optimize resource usage, and improve overall database performance – all this in one IDE. |
| Parameter sniffing analysis | Parameter sniffing is a common issue that can affect the performance of stored procedures and functions. dbForge Studio’s Query Profiler can help identify instances of parameter sniffing by analyzing execution plans and providing recommendations for optimizing parameterized queries. |
| Real-time monitoring | Thee real-time monitoring capabilities of dbForge Studio can capture and analyze query execution plans and performance metrics as queries are executed. This enables developers to identify and address performance issues as they occur, rather than after the fact. |
Conclusion
The execution plan is an essential tool while developing SQL code. It will help you to understand why a specific query is slow or why one query runs faster than another. Both the graphical plans and the XML plans will give you all the data you need, and it’s up to you to decide what to use and when. For those looking for a convenient solution to work with execution plans, dbForge Studio for SQL Server stands out as the premier tool. Its robust features and intuitive interface make it a perfect choice for simplifying database maintenance workflows. To experience the benefits firsthand, download the free 30-day trial version of the Studio and optimize your database management processes today.


