When it comes to database performance optimization, database administrators or developers must understand the differences between blocking and deadlocks in SQL Server because these concepts often need clarification. Blocking and deadlocks help handle access to shared resources when working with concurrent transactions. However, improper management or a lack of awareness about their behavior may lead to performance issues, such as failures and delays in processing transactions.
In the article, we’ll explore the basics of blocking and deadlocks in SQL Server and the difference between these two concepts. We’ll also discuss scenarios and ways to prevent blocking issues and deadlocks. Finally, we’ll examine how to monitor and resolve blocking and deadlock issues using dbForge Studio for SQL Server.
Table of contents:
- Introduction to blocking and deadlocks
- What is blocking in SQL Server?
- What are deadlocks in SQL Server?
- Key differences between blocking and deadlocks
- Use dbForge Studio for SQL Server to analyze locking issues
Introduction to blocking and deadlocks
In any database management system, locks can be used to maintain data integrity during concurrent access to the database. So, it is critical to control concurrent transactions. However, inappropriate usage of locks may introduce challenges, such as blocking and deadlocks, which can greatly impact database performance and lead to the failure of database operations.
Blocking and deadlocks are locking strategies that help coordinate access to shared resources and ensure transactional consistency.
Therefore, a deep understanding of these mechanisms is important for database administrators and developers. Properly addressing blocking and deadlocks can optimize database performance while maintaining data integrity and consistency.
What is blocking in SQL Server?
In SQL Server, blocking is a process that holds the resources another process requires. In this case, the following process has to wait until the resource becomes available. SQL Server allows for only one process to use the resource at a time to keep the data accurate and consistent. While blocking is an expected behavior in a database, its long waiting period can slow down performance and lead to delays.
For example, two transactions – Transaction 1 and Transaction 2 – are trying to access the same row in the Accounts table. Transaction 1 wants to update a row and hasn’t been committed yet, so it holds a lock on that row. At the same time, Transaction 2 tries to read this row but has to wait until Transaction 1 releases its lock. So, after Transaction 1 commits or rolls back, the lock is off, and Transaction 2 can proceed and return the result.
If the READ COMMITTED SNAPSHOT option is enabled at the database level, it means that snapshot-based isolation is on, which avoids blocking for read operations. So, in this case, Transaction 2 would not be blocked by Transaction 1.
Common causes of blocking
Here are some cases that may cause blocking in SQL Server:
- Resource contention: Multiple transactions simultaneously want to access the same resource in conflicting ways. For example, Transaction 1 updates a record and holds a lock, while Transaction 2 tries to read or update the same record and must wait until Transaction 1 finishes.
- Long-running transactions: When a transaction holds onto resources for too long, thus making other transactions wait. For example, you use complex queries or leave transactions open by mistake, such as without
COMMITorROLLBACK. - Lack of proper indexing: When appropriate indexes are missing, queries may require full table scans or page-level locks.
- Excessive usage of locks: When a transaction affects a large amount of data, it might change from locking individual rows or pages to locking the entire table.
- Explicit locking hints: Developers may use explicit locking hints, such as
HOLDLOCKorTABLOCK, which causes some locks. - Poorly designed application logic: Applications may open transactions unnecessarily or hold them open longer than needed due to poor transaction management or client-side processing delays while a transaction remains active.
- Transaction isolation levels: Using a high isolation level, such as
SERIALIZABLE, can increase locking and blocking because it enforces stricter access rules, such as preventing phantom reads.
Detecting blocking in SQL Server
In SQL Server, there are multiple ways to identify and troubleshoot system processes IDs (spids) involved in blocking. They may include:
System stored procedures
You can use a built-in sp_who2 system stored procedure to view blocking information. To see the blocking in action, run the query that checks for active transactions:
EXEC sp_who2;The query returns all active transactions on the server. The statuses RUNNABLE or SUSPENDED mean that they hold a lock. The BlkBy column shows blocking sessions. In our example, the value 53 from the BlkBy column refers to the session ID (the SPID column) for the blocking process.
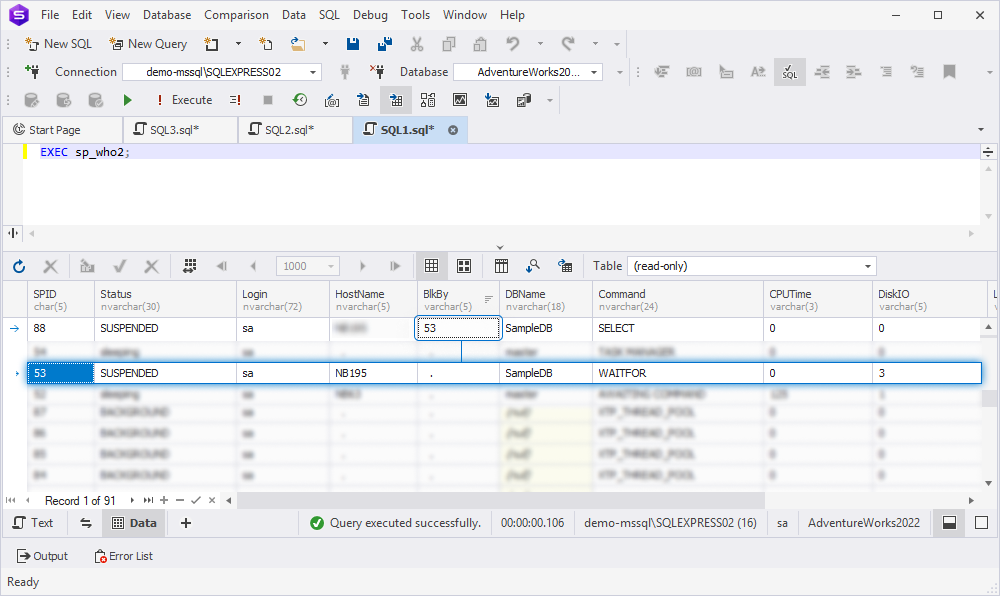
As you can see, it is simple and quick to execute, and no additional setup is required.
Dynamic management views (DMVs)
DMVs can be used to monitor workload performance and detect blocked or long-running queries.
For example, the sys.dm_exec_requests DMV with the specified WHERE condition returns only blocked processes.
SELECT *
FROM sys.dm_exec_requests
WHERE blocking_session_id <> 0;
GO
The sys.dm_os_waiting_tasks DMV lets you view processes currently waiting for resources. Note that running this DMV requires a user to have Administrator or VIEW SERVER STATE permissions on the instance.
SELECT session_id, wait_duration_ms, wait_type, blocking_session_id
FROM sys.dm_os_waiting_tasks
WHERE blocking_session_id <> 0
GO
Activity Monitor
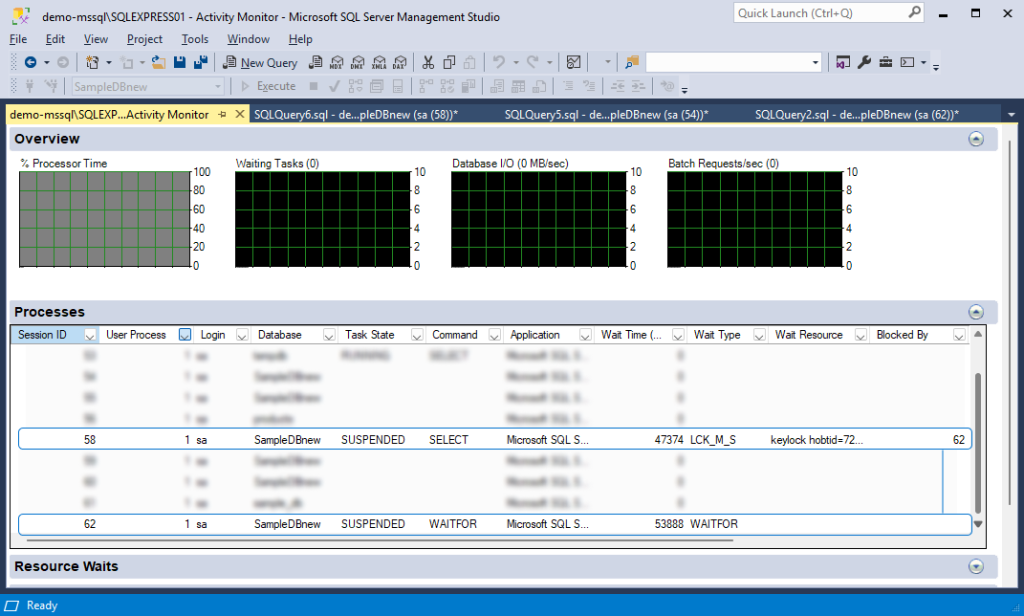
If you prefer working with SQL Server Management Studio (SSMS) instead of executing queries for system objects or stored procedures, you can use the built-in SQL Server Activity Monitor, which allows you to view blocking sessions in real time and analyze session-level behaviour.
To view the server activity:
1. In Object Explorer, right-click the server instance and select Activity Monitor.
2. On the dashboard, expand the Processes pane to see all active sessions.
3. Next to the suspended session, look at the value in the Blocked By column (it shows the session ID causing the block).
The screenshot shows the blocked (#58) and blocking (#62) sessions.
Reports
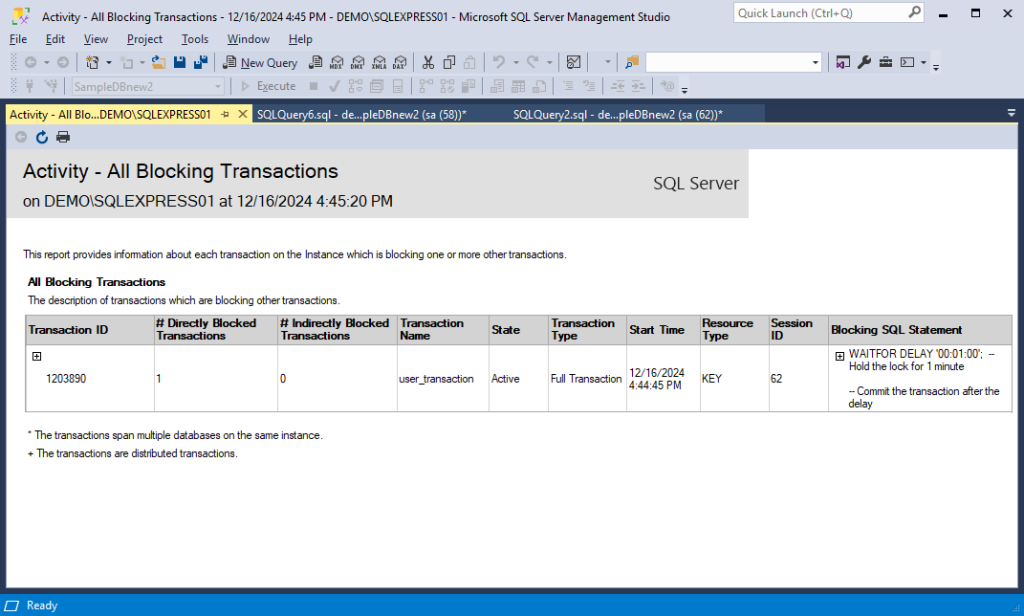
SSMS also allows monitoring blocking transactions using the Reports feature. It can generate a report that shows all blocking transactions on the server instance.
To open the report, right-click the instance name for which you want to check blocking transactions and select Reports > Standard Reports > Activity – All Blocking Transactions.
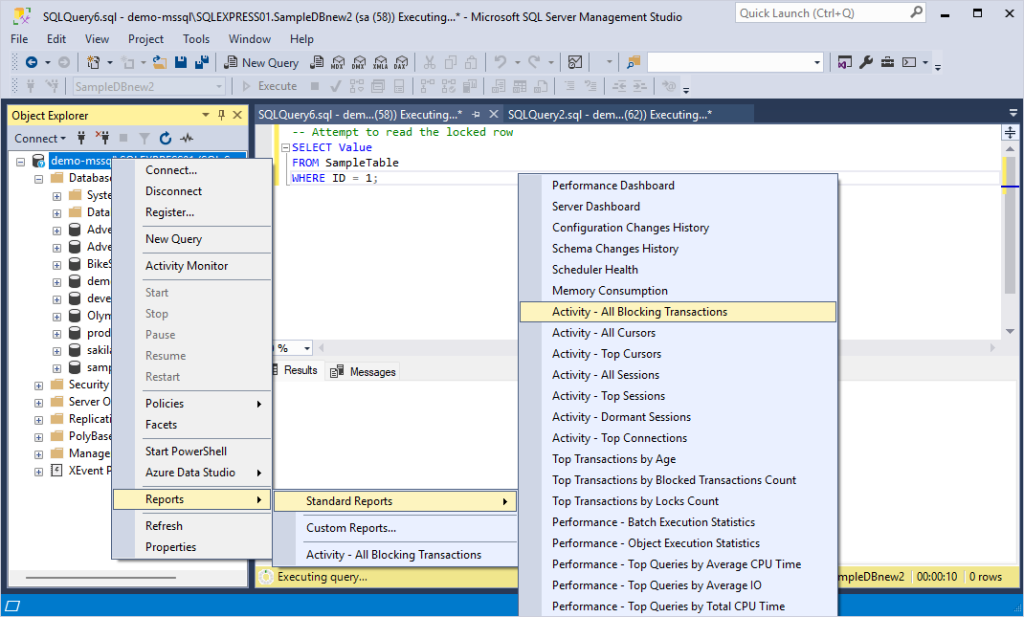
This will open the generated report in a new SQL document.
We have already discussed the reasons for blocking and the cases that might have caused these events. Now, it is time to explore how to minimize or avoid blocking in SQL Server databases.
Strategies to reduce blocking
To reduce blocking, improve concurrency, and enhance the overall performance, it is recommended to optimize queries, use appropriate indexes, and minimize long-running transactions. Here are some practical steps to achieve this:
- Retrieve only the required columns instead of
SELECT *. - Use specific filters with indexed columns in the
WHEREclause. - Avoid joining a lot of tables unless it is required.
- Break large queries, such as updates and deletes, into smaller batches.
- Create indexes on frequently queried columns or those that include only the columns a query needs.
- Regularly rebuild or reorganize indexes to keep them efficient.
- Keep transactions short to release locks quickly.
- Avoid user input while a transaction is open.
- Use
READ COMMITTEDorSNAPSHOTisolation levels to minimize locking. - Avoid high isolation levels, such as
SERIALIZABLE, unless it is necessary. - Use ROWLOCK or PAGLOCK to reduce the scope of locks when possible.
- Avoid TABLOCK unless it is needed for batch operations.
- Use monitoring tools or stored procedure queries (for example,
sys.dm_exec_requests). - Identify and terminate long-running or stuck transactions when necessary.
What are deadlocks in SQL Server?
In contrast to blocking, deadlocks occur when concurrent transactions are stuck because each one holds a lock on a resource that the others need and waits for the other to unlock this resource. As a result, this creates a dependency loop, and the process may take an indefinite period of time. In this case, none of the transactions can move forward until one transaction is aborted with an error by SQL Server, letting the others finish.
For example, transactions are trying to transfer money between two accounts simultaneously.
- Transaction A is transferring money from Account1 to Account2.
- Transaction B is transferring money from Account2 to Account1.
If both transactions try to lock the accounts in different orders, a deadlock can occur.
Common reasons for deadlocks
As discussed, deadlocks arise when two or more transactions are waiting for each other in a dependency cycle, preventing any of them from proceeding. The most frequent reasons for deadlocks are resource order conflicts and high contention.
- Resource order conflicts
Deadlocks often occur because queries with multiple tables or resources don’t follow a consistent locking order. For example, Transaction A locks Resource X and then tries to lock Resource Y. At the same time, Transaction B locks Resource Y and then tries to lock Resource X. Therefore, each transaction waits for the other to release its lock, which results in a deadlock.
- High contention on shared resources
Another reason is that deadlocks may arise due to frequent updates on rows, or long-running queries or transactions holding locks for extended periods. In addition, they may occur if a lot of row-level locks are converted into a single table-level lock.
How can deadlocks be resolved?
SQL Server has a built-in mechanism – lock monitor thread – that automatically identifies and resolves deadlocks to maintain system stability.
The SQL Server Database Engine regularly searches for transactions with potential deadlocks in the background. After detecting a deadlock, SQL Server decides which transaction is a “victim” and can be terminated based on transaction cost or deadlock priority. For example, a transaction with the lowest cost will be chosen as the victim over the other transaction because dropping it will have the slightest impact on system performance.
As for deadlock priority, all transactions have an equal priority by default. However, a developer can explicitly assign deadlock priority to a transaction, such as low, normal (default state) or high, using the SET DEADLOCK_PRIORITY statement. Alternatively, a developer can set deadlock priority to any integer value in the range (-10 to 10).
SET DEADLOCK_PRIORITY HIGH;If sessions from the deadlock cycle have the same deadlock priority and the same cost, SQL Server chooses a victim randomly. If no explicit priority is set, it selects the least expensive transaction to terminate.
After the deadlock “victim” is terminated, its transaction is rolled back. SQL Server then releases any locks the terminated transaction holds, and the other transactions can proceed.
Ways to prevent deadlocks
So far, we have covered how and why deadlocks occur in SQL Server and how they can be resolved. Though they cannot be fully prevented, we can at least minimize deadlocks in SQL Server. Here is a short checklist that may help reduce deadlocks when working with SQL databases:
- Access resources in consistent order.
- Break large transactions into smaller units.
- Avoid user interactions within a transaction.
- Use proper indexes and the lowest required isolation level.
- Avoid overly strict levels, such as SERIALIZABLE, unless they are required.
- Monitor and optimize query performance.
Key differences between blocking and deadlocks
To summarize, the key difference is that a deadlock is a vicious cycle where two or more processes block each other by holding resources the others need, preventing all from proceeding. In contrast, blocking occurs when one process holds a resource that another process requires, making the blocked process wait until the blocking one finishes its operation.
Conceptual differences
The table shows the conceptual differences between blocking and deadlocks in SQL Server.
| Aspect | Blocking | Deadlocks |
| Definition | Process holds a resource; another waits | Processes wait on each other in a cycle |
| Nature | Temporary and resolvable | Permanent unless resolved |
| Cause | Single resource contention | Circular wait condition on multiple resources |
| Resolution | Releases naturally when done | SQL Server must terminate one process (victim) |
| Severity | Causes delays, but not failure | Results in transaction failure |
Transaction impact
While blocking is a standard operation of SQL Server concurrency control, it can greatly impact performance when blocking lasts too long or occurs frequently. Transactions waiting for a resource remain in a queue, which can delay their completion and reduce overall system performance. In addition, if the blocking transaction involves long-running queries or open transactions, it can cause cascading delays where multiple transactions are affected, and will further slow down the database performance.
Deadlocks, on the other hand, have a more severe impact on performance because they cause one or more transactions to fail. When a deadlock occurs, SQL Server detects the circular dependency and terminates one of the transactions, considering it as the deadlock victim, to allow the others to proceed. This rollback wastes processing time and resources, as the failed transaction must be retried. As a result, deadlocks delay transactions and affect system reliability and user experience.
Detection and resolution techniques
The following table summarizes the detection and resolution techniques between blocking and deadlocks in SQL Server.
| Aspect | Blocking | Deadlocks |
| Detection techniques | Activity Monitor Dynamic Management Views (DMVs): sys.dm_exec_requests, sys.dm_tran_locks, and sys.dm_os_waiting_tasksSQL Server Profiler |
SQL Server Error Log system_health session Extended Events |
| Resolution techniques | Identify and kill blocking sessions Reduce transaction time period Reduce lock contention Break long transactions into smaller ones |
Automatically choose a victim to terminate the transaction by SQL Server Access resources consistently Shorten transaction duration Use snapshot isolation levels |
| Impact on performance | Delays in transaction processing | Transaction rollback and failure |
Still, database administrators can reduce the impact of blocking and deadlocks and improve performance if they use the right tools and strategies for detection and resolution.
Use dbForge Studio for SQL Server to analyze locking issues
dbForge Studio for SQL Server is an ultimate SQL Server IDE for database development, management, and administration. This feature-rich toolset lets users perform different database-related operations from a single interface. In addition to its Database Designer, SQL Editor, Query Builder, Schema/Data Compare tools, dbForge Studio offers an advanced Monitor for tracking and detecting blocking issues, Event Profiler for tracing events and queries in real time, and Query Profiler for optimizing database performance.
Monitor is an ultimate monitoring tool that focuses on real-time monitoring and performance analysis of SQL Server databases. It helps database administrators and developers identify and resolve issues, such as slow queries, blocking sessions, and inefficient resource usage.
You can download the Studio with the built-in tools from the Devart website and then install it on your machine.
Let’s showcase the example of detecting a deadlock using the SELECT query and Monitor.
Open the Studio. On the SQL toolbar, select New SQL to open a new SQL document. Then, execute the following script to create a test table, insert data in it, begin a transaction, and lock the table rows.
-- Create a test table
CREATE TABLE DeadlockTest (
    ID INT PRIMARY KEY,
    Value NVARCHAR(50)
);

-- Populate the table with data
INSERT INTO DeadlockTest (ID, Value)
VALUES (1, 'A'), (2, 'B');

-- Begin transaction
BEGIN TRANSACTION;

-- Lock the #1 row
UPDATE DeadlockTest SET Value = 'X' WHERE ID = 1;

-- Enable delay
WAITFOR DELAY '00:00:05';

-- Lock the #2 row
UPDATE DeadlockTest SET Value = 'Y' WHERE ID = 2;
To proceed, open another SQL document and execute the following script. It will run an explicit transaction, meaning all subsequent operations are part of a single transaction. Note that the changes made will not be committed or visible to other sessions until a COMMIT or ROLLBACK is executed.
BEGIN TRANSACTION;

-- Lock the #2 row
UPDATE DeadlockTest
SET Value = 'Z'
WHERE ID = 2;

-- Enable delay
WAITFOR DELAY '00:00:05';

-- Lock the #1 row
UPDATE DeadlockTest
SET Value = 'W'
WHERE ID = 1;
The transaction includes the following operations:
- The UPDATE statement updates the record in the
DeadlockTesttable whereID = 2. WAITFOR DELAY '00:00:05';introduces a 5-second pause in the transaction, simulating a delay, during which the lock on the record (ID = 2) remains active.- The second UPDATE statement tries to update the record where
ID = 1.
Now, open a new SQL document and execute the following SELECT query that helps detect blocking sessions in SQL Server by identifying active requests blocked by other sessions:
SELECT
    r.session_id AS BlockingSessionID,
    r.blocking_session_id AS BlockedSessionID,
    t.text AS QueryText
FROM sys.dm_exec_requests r
OUTER APPLY sys.dm_exec_sql_text(r.sql_handle) t
WHERE r.blocking_session_id > 0;
where:
sys.dm_exec_requestsis a dynamic management view that shows details about all active requests executed in SQL Server. Each request represents a specific action, such as a query or stored procedure, that SQL Server is processing.blocking_session_id > 0indicates that the session represented byr.session_idis blocked by another session.
The query returns the ID of the blocking session holding the resource and the ID of the blocked session. The query also retrieves the SQL text of the query executed by the blocked session. It helps identify which query is a blocking one.
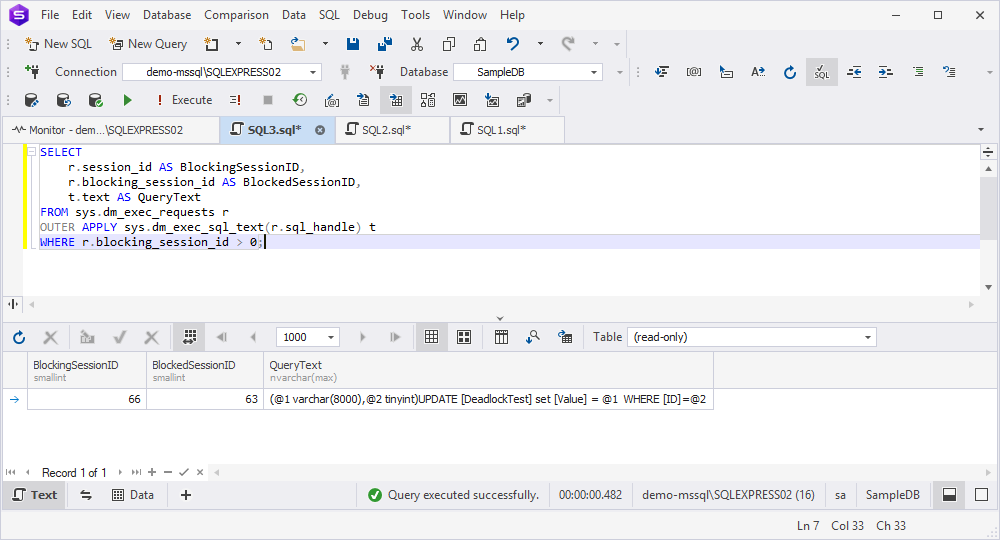
Now, open Monitor by selecting Database on the ribbon and then selecting Tasks > Show Monitor. In the Monitor document that opens, navigate to the Sessions tab.
Note that we filtered the results by the SampleDB database for better readability.
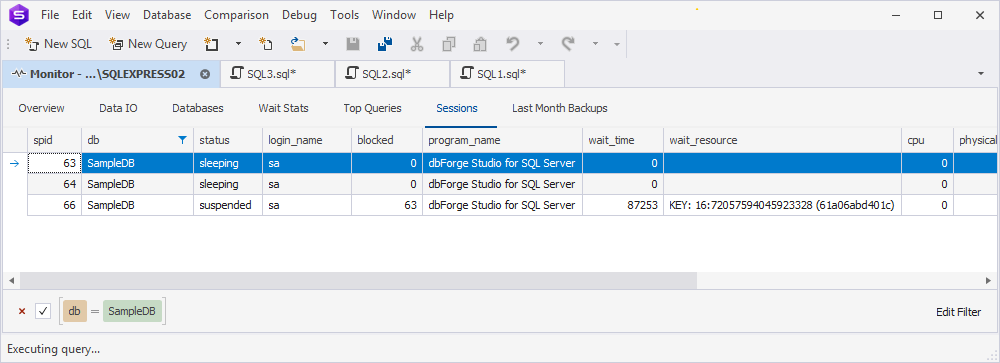
As you can see, the session with spid #66 has the suspended status. This means that a session is paused, waiting for a resource that is currently locked by another session. The blocking session has spid #63, and it is displayed in the blocked column of the results grid.
To resolve the lock, use the KILL LOCK or KILL LOCK SESSION query:
- For a blocking transaction, execute the
ROLLBACKcommand
or
- Open a new SQL document and execute the
KILL id_numberquery, whereid_numberis the ID of the blocking session.
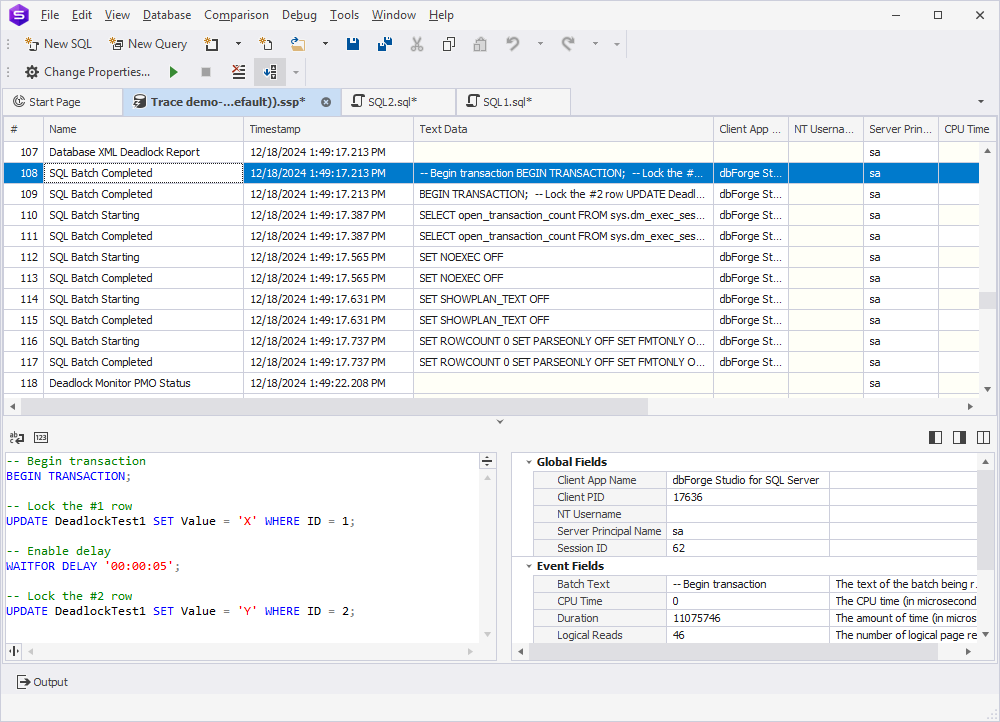
If you want to see events connected with deadlocks, use dbForge Studio for SQL Server profiling feature. It is designed for real-time monitoring and analysis of SQL Server events and queries. The tool helps troubleshoot performance issues, optimize queries, and understand how the SQL Server engine processes requests.
You can set up the profiling of server events in the Profile Server Events wizard. To open it, in Database Explorer, right-click the connection and select Tasks > Profile Server Events.
On the Events To Capture page of the wizard, select the deadlock events to be captured and then select Execute.
For easier search, you can enter deadlock in the Search bar in the upper-right corner of the wizard.
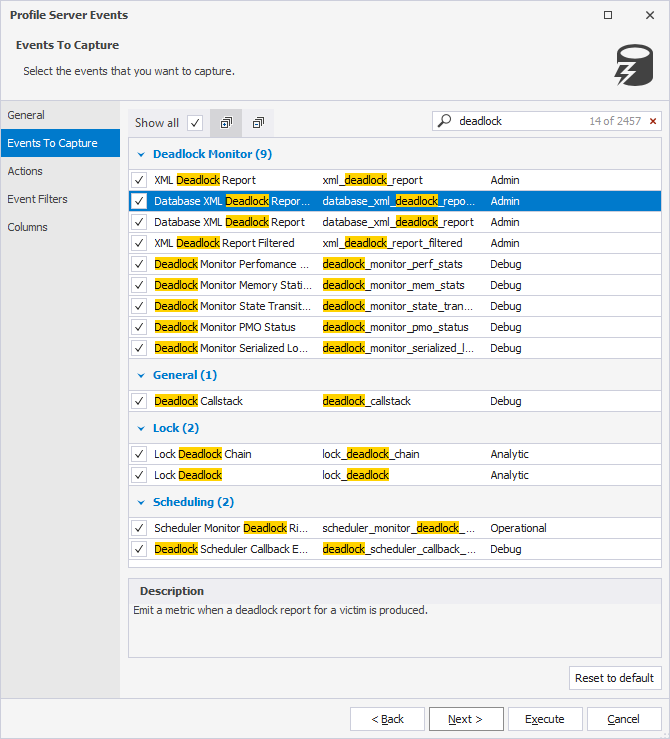
Event Profiler will display the information in real time according to the configured options.
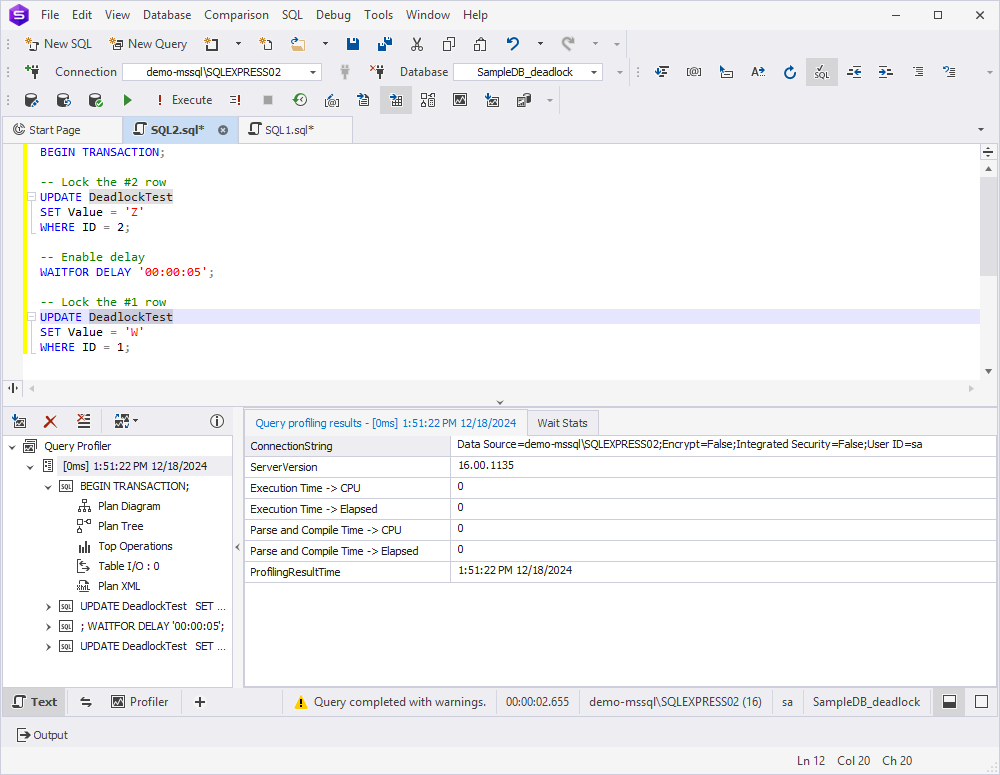
Should you need to optimize query performance, the best tool to cope with this is Query Profiler. It provides a detailed visual representation of query execution plans, including locking behavior and resource usage.
For example, the Wait Statistics tab of Query Profiler helps understand which events caused delays and how long resources were held during query execution.
For long-running queries, Query Profiler allows users to visualize time-consuming operations and identify specific parts of SQL code that lead to poor performance. Moreover, users can compare query profiling results to track improvements or regressions over time.
Conclusion
In the article, we have examined how important it is to understand and manage blocking and deadlocks to maintain optimal database performance and correct transaction processing. Blocking can cause great delays if it is not properly managed. Deadlocks, however, may have a severe impact and can completely suspend transactions, requiring SQL Server to resolve them.
In the article, we have also provided detection and resolution techniques to minimize the impact of blocking and deadlocks on the database using queries and dbForge Studio for SQL Server. The latter is a perfect choice for optimizing queries, monitoring, and analyzing locks in addition to its other advanced features and tools.
Download dbForge Studio for SQL Server to design, develop, and manage databases and evaluate all the features it provides within a free 30-day trial period.

