
Read this article to know how to use SQL Server Activity Monitor and what other SQL monitoring tools you can use to monitor SQL Server performance to be aware of possible performance issues.
Table of contents:
- What is Activity Monitor in SQL Server?
- Permissions to use Activity Monitor
- How to start Activity Monitor
- SQL Server Activity Monitor panes
- Monitor SQL Server queries via T-SQL commands
- Enhanced real-time SQL Server monitoring tool
- Conclusion
- Frequently asked questions
What is Activity Monitor in SQL Server?
Activity Monitor in SQL Server Management Studio (SSMS) is a tabbed document window with six panes. On Activity Monitor, you can track SQL Server processes and the way how these processes affect the instance.
The tool allows controlling and troubleshooting SQL Server performance issues. Collected performance data is displayed graphically.
Permissions to use Activity Monitor
To be able to see data on Activity Monitor, you must have the following permissions:
- VIEW SERVER STATE – to check the activity
- CREATE DATABASE, ALTER ANY DATABASE, or VIEW ANY DEFINITION with VIEW SERVER STATE – to check the Data File I/O pane
How to start Activity Monitor
There are several ways to launch Activity Monitor in SSMS:
- Way 1 – from the toolbar
- Way 2 – from the Object Explorer
- Way 3 – from the Options menu
If Activity Monitor opens but displays no data, it may be due to version-specific bugs or permission issues. See this SQLServerCentral thread for troubleshooting tips.
Way 1 – from the toolbar
Just click the following icon:
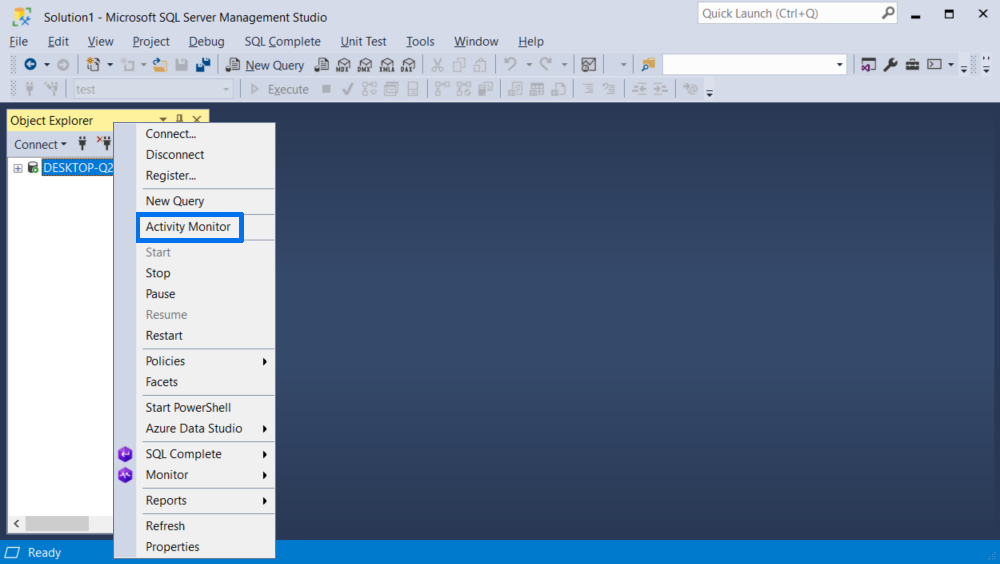
Way 2 – from the Object Explorer
Right-click the SQL Server connection and click Activity Monitor:
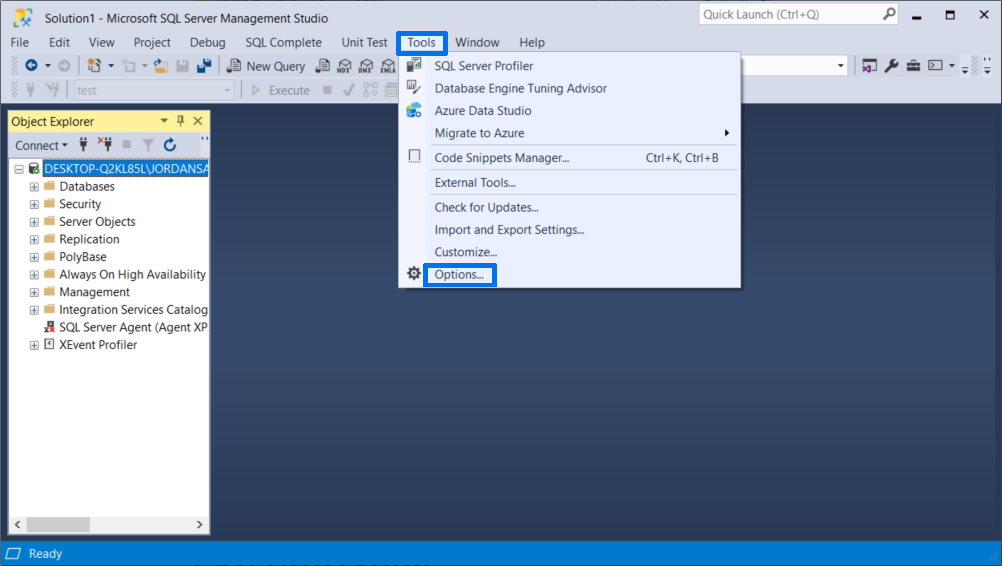
Way 3 – from the Options menu
1. Navigate to Tools > Options:
2. Click Startup and select Open Object Explorer and Activity Monitor from the drop-down menu:
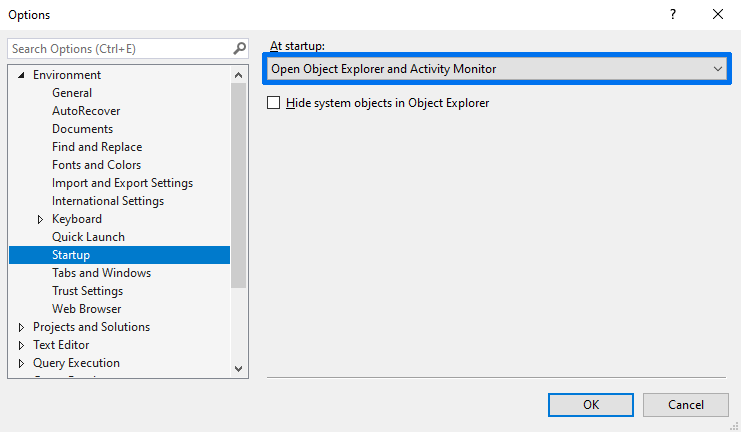
3. Finally, click OK.
SQL Server Activity Monitor panes
Activity Monitor has the following panes: Overview, Processes, Resource Waits, Data File I/O, Recent Expensive Queries, and Active Expensive Queries. Each pane is expandable and collapsible.
When expanded, a pane begins querying for real-time data; when collapsed, it stops. Multiple panes can be expanded at the same time for simultaneous insights.
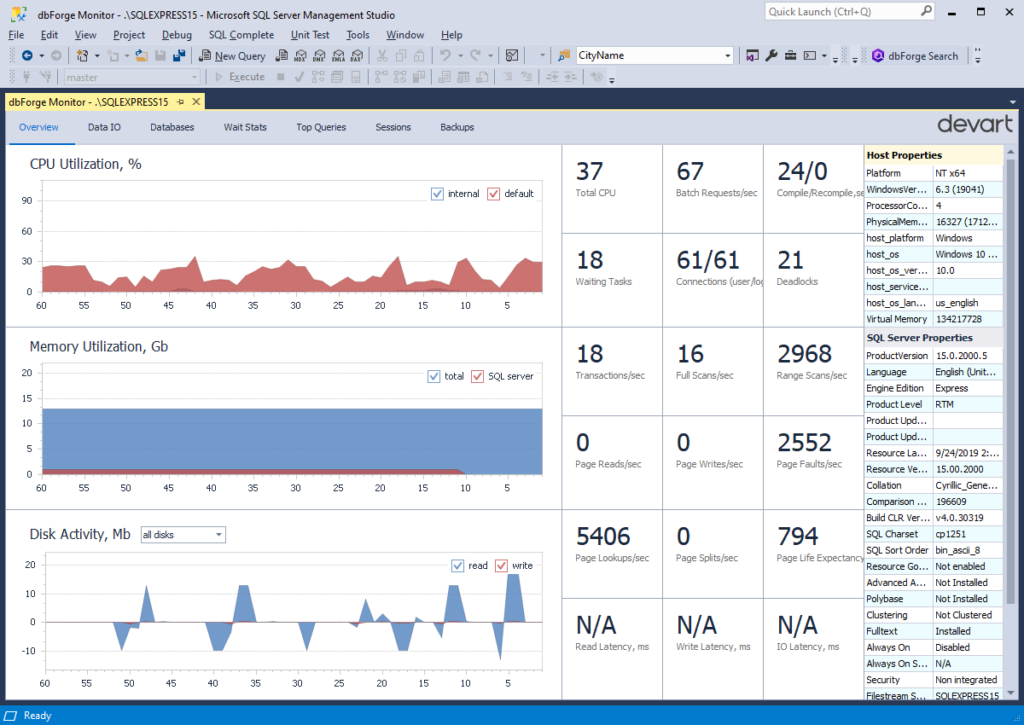
To better understand the capabilities of Activity Monitor, let’s compare it with a more convenient dbForge Monitor. While Activity Monitor provides essential real-time insights within SSMS, dbForge Monitor extends that functionality with deeper query profiling, richer visualizations, and automatic refresh capabilities.
The table below highlights the key differences:
SQL Server Activity Monitor vs dbForge Monitor
| Activity Monitor Pane / Feature | Purpose in SSMS | Enhanced Features in dbForge Monitor |
|---|---|---|
| Overview | Real-time charts for CPU, wait tasks, I/O, and batch requests | Customizable dashboards with live metrics and history tracking |
| Processes | Lists running sessions and their current commands, blocking, and wait time | Interactive session management and filtering options |
| Resource Waits | Displays the types and durations of server waits to diagnose bottlenecks | Detailed wait type categorization with visual indicators |
| Data File I/O | Shows read/write stats for data files in each database | File I/O stats with export options and trend analysis |
| Recent Expensive Queries | Lists recently executed queries that used significant resources | Historical profiling of top queries and performance comparison over time |
| Active Expensive Queries | Displays resource-heavy queries currently in execution | Real-time query profiling with execution plan and wait stats |
| Data Refresh (Limitation) | Data refresh must be triggered manually for each pane | Auto-refresh with customizable intervals and live updates across all metrics |
| Permissions Required | VIEW SERVER STATE, VIEW ANY DEFINITION, etc. | Similar requirements, but extended visual access without custom scripts |
| Query Profiler | Not available in Activity Monitor | Full-featured query profiler for plan analysis and resource usage breakdown |
Activity Monitor Overview pane
The Overview pane provides a quick overview of the instance performance. In the pane, you can see four graphical displays:
- Processor Time is the percentage of time that processors spend on executing running threads
- Waiting Tasks is the number of tasks that will be performed when the processor is released
- Database I/O is data transmission speed from memory to disk, disk to memory, or disk to disk in MB/s
- Batch Requests is the number of batches that the SQL Server instance receives in a second
Activity Monitor Processes pane
The Processes pane displays a report on active users who run processes on the SQL Server instance. The report has the following columns:
- Session ID is an ID of a user’s connection
- User Process is a process identifier: 0 is for the system processes, 1 is for the user’s processes
- Login is a login name that runs a session on the SQL Server instance
- Database is a database where a process runs
- Task State is a state of a task. If a task is in a runnable or sleeping state, the state is blank
- Command is the current type of the command
- Application is the name of the application that created the connection
- Wait Time is time, in milliseconds, for the task that waits for resources
- Wait Type is the name of the current or last wait type
- Wait Resource is a resource name that the connection waits for
- Blocked By is a session ID that blocks a task
- Head Blocker is a session that causes the first blocking condition
- Memory Use is the amount of memory that a task uses
- Host Name displays the name of a computer that connects to the SQL Server instance
- Workload Group is the name of the Resource Governor workload group for the connection
Activity Monitor Resource Waits pane
The Resource Waits pane contains a report on waits for resources. There are the following columns in the report:
- Wait Category has a list of categories with closely related wait types
- Wait Time displays the time for tasks that wait for resources
- Recent Wait Time is the average time for tasks that wait for resources
- Average Waiter Count is a number of tasks that wait for resources at a specific moment in the last sample interval
- Cumulative Wait Time specifies the time that tasks have waited for resources since the last restart of the SQL Server instance
Activity Monitor Data File I/O pane
The Data File I/O pane provides information about database files on the SQL Server instance. In the pane, you can see the following columns:
- Database is a database name
- File Name is a file name of a database
- MB/sec Read displays recent read activity for a file
- MB/sec Written displays recent write activity for a file
- Response Time is the response time for the read-and-write activity
Activity Monitor Recent Expensive Queries pane
The Recent Expensive Queries pane helps you to identify queries that use much resources. You can get information from the following columns:
- Query is a monitored query statement
- Executions/min is the number of executions per minute for a query
- CPU (ms/sec) is the CPU usage rate by request
- Physical Reads/sec is a rate of physical reads by a query
- Logical Writes/sec is a rate of logical writes by a query
- Logical Reads/sec is a rate of logical reads by a query
- Average Duration (ms) is the average time of a query execution
- Plan Count is a number of cached query plans for a query
Monitor SQL Server queries via T-SQL commands
You can also use T-SQL queries to check SQL Server performance. In this section, we have listed three alternative ways of monitoring SQL Server health.
Query SQL Server performance via dynamic management views
Dynamic management views (DMVs) are related to SQL Server Operating System (SQLOS). SQLOS manages the operating system resources of SQL Server.
To start querying DMVs, you must have the following permissions:
- SELECT on object
- VIEW SERVER STATE or VIEW DATABASE STATE
All dynamic management views have names starting with sys.dm_ in the sys schema. You can check a list of available dynamic management views in the SQL Server Operating System Related Dynamic Management Views (Transact-SQL) document.
For example, to query memory information from SQL Server operating system, you can run the following query:
SELECT total_physical_memory_kb
FROM sys.dm_os_sys_memory;
And you will get the result, for example:
| total_physical_memory_kb | |
| 1 | 16449800 |
Query general maintenance of SQL Server via system stored procedures
System stored procedures are an alternative way to monitor SQL Server metrics. You can check a list of supported system stored procedures in the “Database Engine Stored Procedures (Transact-SQL)” document. Pay attention to the fact that each system stored procedure requires having some permissions.
For example, to check all active processes on the instance, run the following system stored procedure:
USE master;
GO
EXEC sp_who 'active';
GO
You will see data similar to this:
| spid | ecid | status | loginame | hostname | blk | dbname | cmd | request_id | |
| 1 | 1 | 0 | background | sa | 0 | NULL | XIO_RETRY_Worker | 0 | |
| 2 | 2 | 0 | background | sa | 0 | NULL | XIO_LEASE_RENEWAL_WORKER | 0 | |
| 3 | 3 | 0 | background | sa | 0 | NULL | RECOVERY WRITER | 0 |
Query system data of SQL Server via built-in functions
SQL Server also supports a set of built-in functions for you to be able to monitor system information. You can check a list of all available functions in the Monitor SQL Server Performance and Activity with Built-In Functions document.
For example, to query CPU processing time in milliseconds for SQL Server activity, run the following built-in function:
SELECT @@cpu_busy AS "CPU Busy";
GO
The query will return the result as follows :
| CPU Busy | |
| 1 | 381964 |
Gather SQL Server metrics via System Data collection sets
If you want to store and generate reports on metrics gathered from the SQL Server instance, you can use System Data collections sets. System Data collection sets include the following components:
- Disk Usage that collects disk data and logs usage for all the databases in the system
- Server Activity that collects statistics of resource usage and performance data from SQL Server
- Query Statistics that collects query statistics, query plans, specific queries, and individual query text
You can read more about System Data collection in the System Data Collection Sets document.
A collection set retrieves data from dynamic management views and reporting commands, then sends the collected data to the management data warehouse.
Enhanced real-time SQL Server monitoring tool
Monitoring the SQL Server performance and activity is very important in order to avoid system failures. That is why Activity Monitor in SQL Server Management Studio includes such critical and crucial tracking parameters.
Additionally, you can use dbForge Monitor to stay informed about the capacity of databases and servers in real-time.
dbForge Monitor comes as a free add-in for SSMS and as a part of dbForge Studio for SQL Server.
Among all the tracking parameters, we would like to pay your attention to the one that keeps track of queries, which consume much resources. In most cases, such queries are the reason why SQL Server has low performance. dbForge Monitor comes with Query Profiler that helps to be aware of slow running queries:
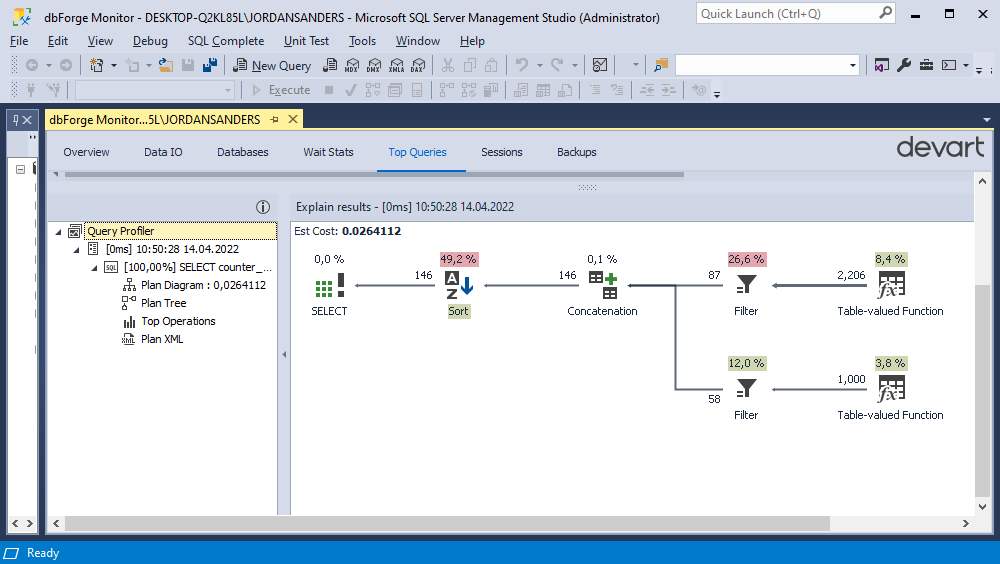
The tool aims to set and analyze SQL query performance and fix issues. Query Profiler contains the following information:
- Date and time of the query
- Total execution and planning time
- Graphical plan diagram
- Plan tree
- Top operations within the query plan
- Table input/output
- XML version of the query plan
Conclusion
In this article, we have found out what SQL Activity Monitor is and what panes it consists of. Also, we have reviewed alternative ways to monitor SQL Server performance. As you can see, an effective monitoring tool is a must-have. You can download dbForge Monitor absolutely for free or dbForge Studio for SQL Server for a free 30-day trial and try Activity Monitor to understand how powerful this tool is. And feel free to watch this video to get more information about dbForge SQL Monitor:
Frequently asked questions
What is an Activity Monitor in SQL Server?
Activity Monitor is a performance diagnostic tool built into SQL Server Management Studio (SSMS). It provides real-time visibility into key metrics such as active processes, I/O throughput, wait statistics, and high-impact queries. It’s commonly used for identifying performance bottlenecks without requiring custom scripts or third-party tools.
How to give access to Activity Monitor in SQL Server?
To access Activity Monitor, a user must be granted the VIEW SERVER STATE permission on the SQL Server instance. For visibility into specific panes—such as Data File I/O—additional permissions like CREATE DATABASE, ALTER ANY DATABASE, or VIEW ANY DEFINITION may also be required.
How to view a job Activity Monitor in SQL Server?
SQL Server Agent jobs can be monitored using the Job Activity Monitor available under SQL Server Agent in SSMS. For script-based access, system stored procedures such as sp_help_jobactivity or sp_help_jobhistory can be executed to retrieve job status and execution details.
How to check activity in SQL?
You can monitor SQL Server activity through various methods, including Activity Monitor, system stored procedures (sp_who2, sp_whoisactive), dynamic management views (e.g., sys.dm_exec_requests, sys.dm_exec_sessions), and custom performance queries depending on the required granularity.
How to check the active session in SQL Server?
Use the sys.dm_exec_sessions DMV to retrieve details on all active user and system sessions. Alternatively, the Processes pane in Activity Monitor provides a live, visual overview of session states, blocking chains, and resource consumption.
Where is the SSMS Activity Monitor?
In SSMS, Activity Monitor can be accessed in several ways:
- From the toolbar (Activity Monitor icon)
- By right-clicking a server in Object Explorer and selecting Activity Monitor
- Via Tools > Options > Startup, setting it to launch automatically on SSMS start