
The data stored in the history of queries are among the most valuable for any DBA. Tracking back the SQL Server query history is a must in many cases. For instance, there might be a need to investigate a particular work case, check the backup history, or recover a specific query if your SQL Server suffers a crash.
Fortunately, for any failure or routine analysis task, the full SQL Server query history is present, and there are user-friendly solutions to work with these data.
When you need to review the data about executed SQL statements in SSMS for a particular period, you can use several options:
- Queries are saved in the cache via system representations (sys.dm_exec_query_stats, sys.dm_exec_sql_text, and sys.dm_exec_query_plan)
- Using SQL Server Profiler
- Using Extended Events
- Using the Query Store, starting from the 2016 version
- Using SQL Complete (SQL Complete\Query History) in SSMS
The option #1, for instance, lets you output 100 queries with the highest execution time (including all delays) using the following script:
with s as (
select top(100)
creation_time,
last_execution_time,
execution_count,
total_worker_time/1000 as CPU,
convert(money, (total_worker_time))/(execution_count*1000)as [AvgCPUTime],
qs.total_elapsed_time/1000 as TotDuration,
convert(money, (qs.total_elapsed_time))/(execution_count*1000)as [AvgDur],
total_logical_reads as [Reads],
total_logical_writes as [Writes],
total_logical_reads+total_logical_writes as [AggIO],
convert(money, (total_logical_reads+total_logical_writes)/(execution_count + 0.0)) as [AvgIO],
[sql_handle],
plan_handle,
statement_start_offset,
statement_end_offset,
plan_generation_num,
total_physical_reads,
convert(money, total_physical_reads/(execution_count + 0.0)) as [AvgIOPhysicalReads],
convert(money, total_logical_reads/(execution_count + 0.0)) as [AvgIOLogicalReads],
convert(money, total_logical_writes/(execution_count + 0.0)) as [AvgIOLogicalWrites],
query_hash,
query_plan_hash,
total_rows,
convert(money, total_rows/(execution_count + 0.0)) as [AvgRows],
total_dop,
convert(money, total_dop/(execution_count + 0.0)) as [AvgDop],
total_grant_kb,
convert(money, total_grant_kb/(execution_count + 0.0)) as [AvgGrantKb],
total_used_grant_kb,
convert(money, total_used_grant_kb/(execution_count + 0.0)) as [AvgUsedGrantKb],
total_ideal_grant_kb,
convert(money, total_ideal_grant_kb/(execution_count + 0.0)) as [AvgIdealGrantKb],
total_reserved_threads,
convert(money, total_reserved_threads/(execution_count + 0.0)) as [AvgReservedThreads],
total_used_threads,
convert(money, total_used_threads/(execution_count + 0.0)) as [AvgUsedThreads]
from sys.dm_exec_query_stats as qs with(readuncommitted)
order by convert(money, (qs.total_elapsed_time))/(execution_count*1000) desc
)
select
s.creation_time,
s.last_execution_time,
s.execution_count,
s.CPU,
s.[AvgCPUTime],
s.TotDuration,
s.[AvgDur],
s.[AvgIOLogicalReads],
s.[AvgIOLogicalWrites],
s.[AggIO],
s.[AvgIO],
s.[AvgIOPhysicalReads],
s.plan_generation_num,
s.[AvgRows],
s.[AvgDop],
s.[AvgGrantKb],
s.[AvgUsedGrantKb],
s.[AvgIdealGrantKb],
s.[AvgReservedThreads],
s.[AvgUsedThreads],
--st.text as query_text,
case
when sql_handle IS NULL then ' '
else(substring(st.text,(s.statement_start_offset+2)/2,(
case
when s.statement_end_offset =-1 then len(convert(nvarchar(MAX),st.text))*2
else s.statement_end_offset
end - s.statement_start_offset)/2  ))
end as query_text,
db_name(st.dbid) as database_name,
object_schema_name(st.objectid, st.dbid)+'.'+object_name(st.objectid, st.dbid) as [object_name],
sp.[query_plan],
s.[sql_handle],
s.plan_handle,
s.query_hash,
s.query_plan_hash
from s
cross apply sys.dm_exec_sql_text(s.[sql_handle]) as st
cross apply sys.dm_exec_query_plan(s.[plan_handle]) as sp
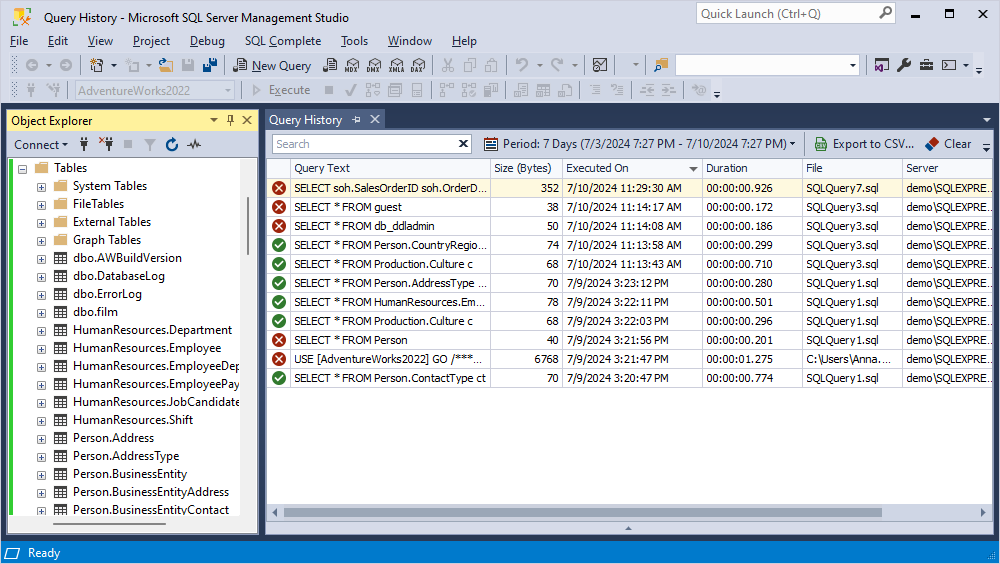
As for the other options, it is worth highlighting the possibility of using SQL Complete in SSMS.
SQL Complete stores the primary information about the executed SQL statements in SSMS for a specified period. With this SSMS add-in, you can view, edit, and search T-SQL queries run in the database. A convenient interface makes this job more manageable.
Particularly, note the following features provided by SQL Complete:
- Check the execution of SQL statements – you may define if they succeeded or failed
- View the data in the query history for a particular period
- Sort the data for multiple criteria
- Search for a particular statement – it is convenient for any analyst working with large amounts of data
The SQL Complete solution stores every statement that you run in a file on a disk or in a table in a database specified with a connection string. The storage period can be any – you set it yourself in the SQL Complete options. Hence, if you’re working on a script, you get the full history related to every change you’ve made. Yet keep in mind that SQL Complete stores the history only for the queries executed via SSMS that SQL Complete is integrated with.
SQL Statements are saved in a list written to a file and/or a database. The solution can delete the older SQL query history logs automatically. Additionally, you can monitor who and when executed any particular query, or receive other valuable information for research and analysis.
You can use any resource for checking the MS SQL Server query history by user. A variety of tools to perform the task is simply and conveniently at your service.
You can find more information regarding SQL Query History in the corresponding topic of the Documentation.
| Method | Description | Ease of Use | Key Features |
|---|---|---|---|
| Dynamic Management Views (DMVs) | Uses system views like sys.dm_exec_query_stats, sys.dm_exec_sql_text, and sys.dm_exec_query_plan to retrieve query execution statistics and history. | Moderate | – Displays cached query execution data- Allows detailed query performance analysis- Data cleared on server restart |
| SQL Server Profiler | A tool that captures real-time query execution details. | Moderate to Advanced | – Real-time query tracking- Captures execution data like duration, reads, writes, and CPU usage- May impact server performance under load |
| Extended Events | A lightweight event tracking system for monitoring SQL Server activity, including query execution history. | Moderate to Advanced | – Low-impact performance monitoring- Fine-grained control over which events to track- Suitable for long-term monitoring |
| Query Store (SQL Server 2016+) | Stores historical execution data, including performance metrics, and allows for query performance tuning and analysis. | Easy to Moderate | – Retains query history across restarts- Provides performance insights- Allows query performance tuning |
| SQL Complete (SSMS Add-in) | An SSMS add-in that logs executed SQL statements and allows for easy retrieval, searching, and analysis of queries. | Easy | – Stores query history for a specified period- Allows searching, sorting, and viewing past queries- Data saved to a file locally. |
FAQ
How do I view SQL Server query history?
You can view SQL Server query history using Dynamic Management Views and checking sys.dm_exec_query_stats, sys.dm_exec_sql_text, and sys.dm_exec_query_plan for cached query execution data, or via SQL Server Profiler, which captures real-time query execution details. Alternative methods include checking Query Store (available for SQL Server 2016+) for query execution history and using SQL Complete add-in for SSMS Add-in to explore executed SQL statements.
Where is SQL Server history log?
SQL Server does not maintain a built-in persistent query history log, but you can still find query execution data stored in SQL Server cache (you can check it for recent query execution details, but it is cleared on server restart), and Query Store (you can use it to retain execution history across restarts if it’s enabled). In case you want to access query history using more advanced features, like search, view, and perform query history analysis, check the SQL Complete SSMS add-in that saves query history to a file or database for long-term tracking.
How to see last executed query in SQL Server?
To retrieve the last executed query, you can use DMVs. Alternative methods include using SQL Server Profiler or Extended Events that capture real-time query execution details and SQL Complete add-in for SSMS, which displays the most recently executed SQL statements with timestamps.