
The article presents a detailed overview of the Code Debugger functionality that comes with dbForge Fusion for MySQL – a powerful MySQL development add-in for Visual Studio.
During the development of database elements such as procedures, functions, triggers, and mere SQL scripts, there is a high probability of errors. The more complex your code is, the more difficult it is to debug it. Thus, sometimes a significant part of the development time is spent on finding and fixing errors.

What is debugging in Visual Studio?
Visual Studio has an in-built debugger. It is supported in all versions of the Studio and the manufacturer claims it is the core functionality of the IDE. Like other debugging tools, Visual Studio debugger provides capabilities for main debugging tasks: live debugging, inserting breakpoints, stepping into individual statements (Step Into, Step Out, Step Over), evaluating and changing variable values, etc.
Visual Studio debugger freezes and failures
However, lots of users claim to be experiencing various issues when actively debugging – the debugger in Visual Studio simply isn’t working properly. Those problems vary from “Visual Studio cannot start debugging” to “the IDE freezes on debug mode”. That forces developers to look for alternatives. And one of those is the dbForge Fusion for MySQL plugin.
Visual Studio Debugger in dbForge Fusion for MySQL plugin
dbForge Fusion for MySQL is designed to simplify MariaDB and MySQL database development and optimize data management. With the plugin, you can perform all database development and administration tasks directly from Visual Studio. Lightweight and flexible dbForge Fusion for MySQL provides a convenient way to explore and maintain existing databases, design SQL statements and queries, as well as manipulate data in different ways.
dbForge Fusion for MySQL contains a bunch of useful MySQL tools for Visual Studio, the most valuable of them being Code Debugger.
The Code Debugger functionality that comes with dbForge Fusion for MySQL is bound to reduce time spent on searching for bugs and investigating why the code fails.
Compatibility:
- Visual Studio 2019
- Visual Studio 2017
- Visual Studio 2015
- Visual Studio 2013
Debugging doesn’t necessarily need to be painful. And we will prove it using the example of MySQL debug stored procedure functionality integrated in dbForge Studio for MySQL.
How to debug a stored procedure
Step 1. Compile a stored procedure for debugging
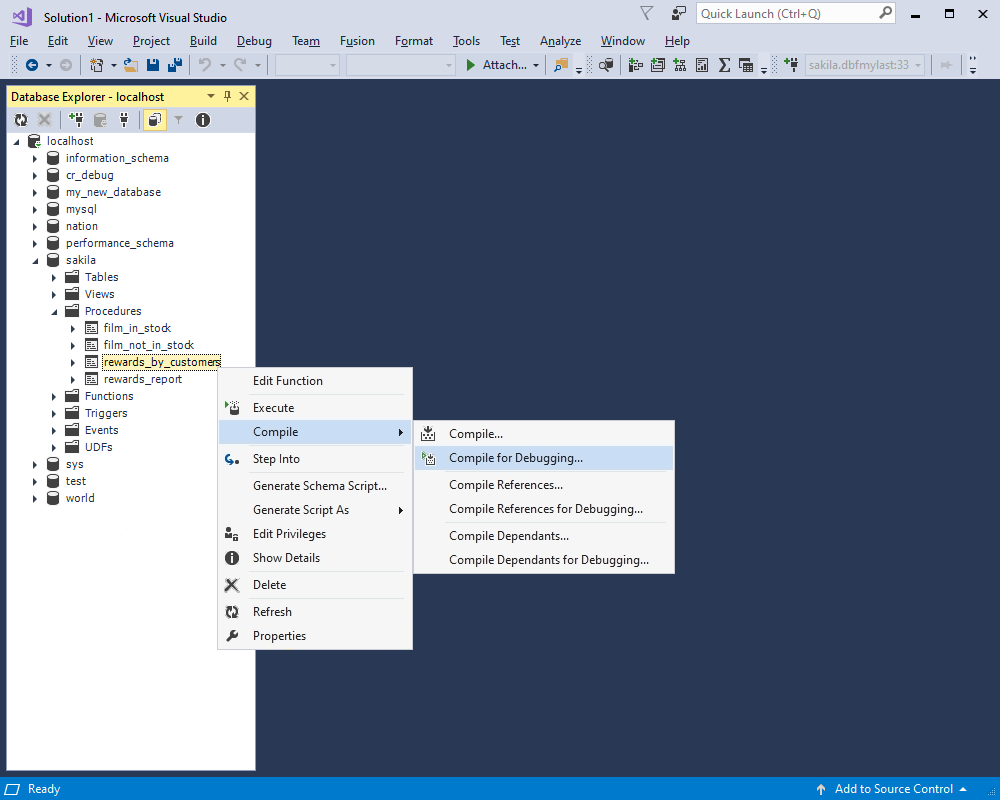
Before starting to debug a procedure, you need to compile it for debugging.
To compile a stored procedure for debugging, right-click it in Database Explorer, point to Debug, and then select Compile for Debugging as shown on the screenshot below.
Step 2. Set breakpoints
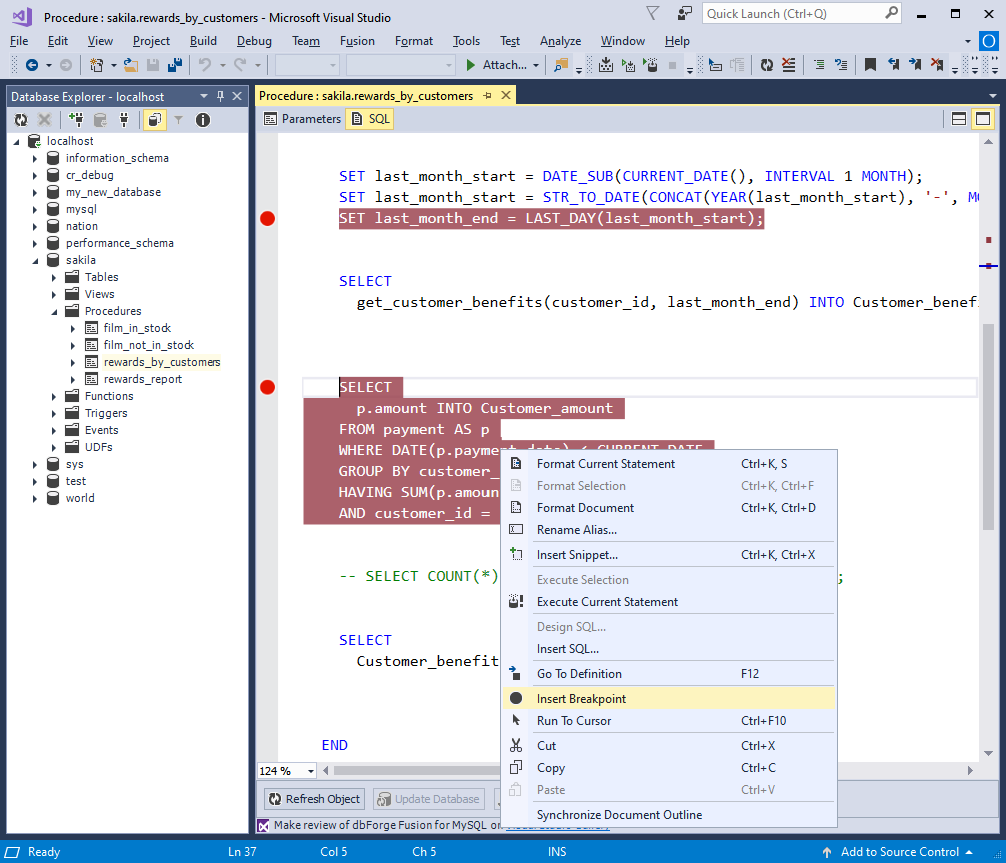
Breakpoints mark the places in your code where program execution pauses letting you examine debugging data and program behavior. Breakpoints can be simple (for example, pausing the program on reaching a specific line of code) or entail more complex logic (checking against additional conditions, creating log messages, etc.).
You can insert a breakpoint by using one of the following methods:
- right-click a line of executable code where you want to set a breakpoint and select Insert Breakpoint
- place the cursor where you want to set a breakpoint and press F9
- click in the far left margin next to a line of code where you want to set a breakpoint.
Step 3. Start debugging
Press F11 to start debugging. It is the Step Into command and it makes the app execute one statement at a time.
If the line contains a call to any stored database object, you can go to the definition of that object. All you need is to place a cursor on that object and press F12 or right-click the object and click Go to Definition. In our case, the script calls a stored function.
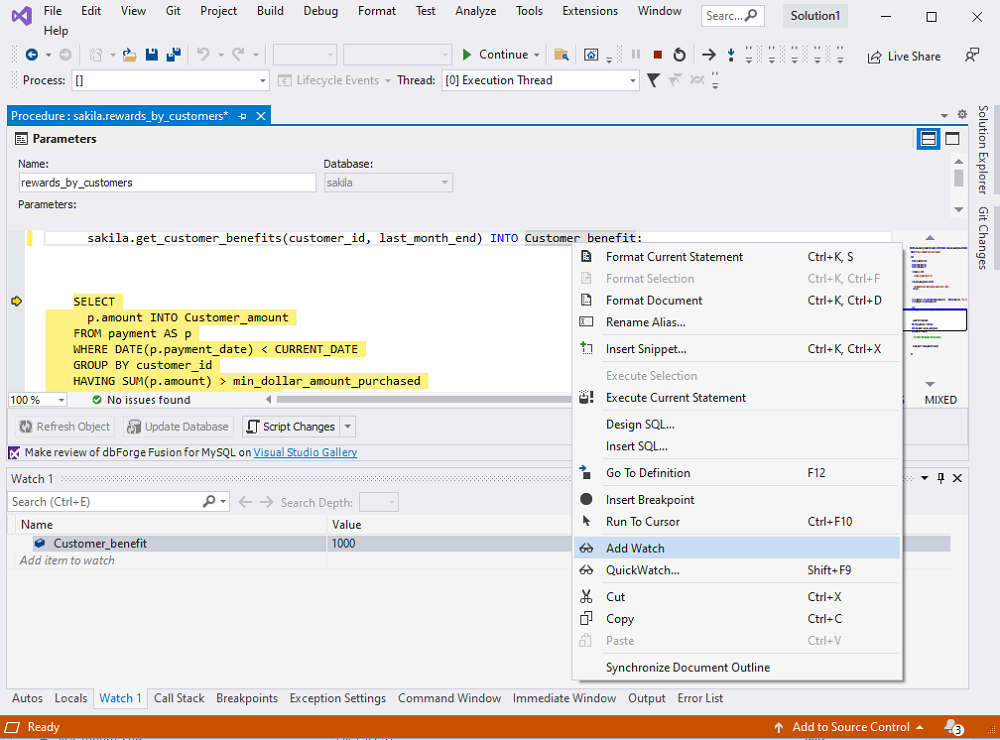
Step 4. Add variables
You can trace the changes to variables on the Autos tab. The tool also allows you to add a variable or cursor to a separate watchlist and see how the values change after the manipulations with that variable. If something goes wrong, you will immediately understand where the error occurs.
You can see instantly see how the variables change by hovering a cursor on them in the script.
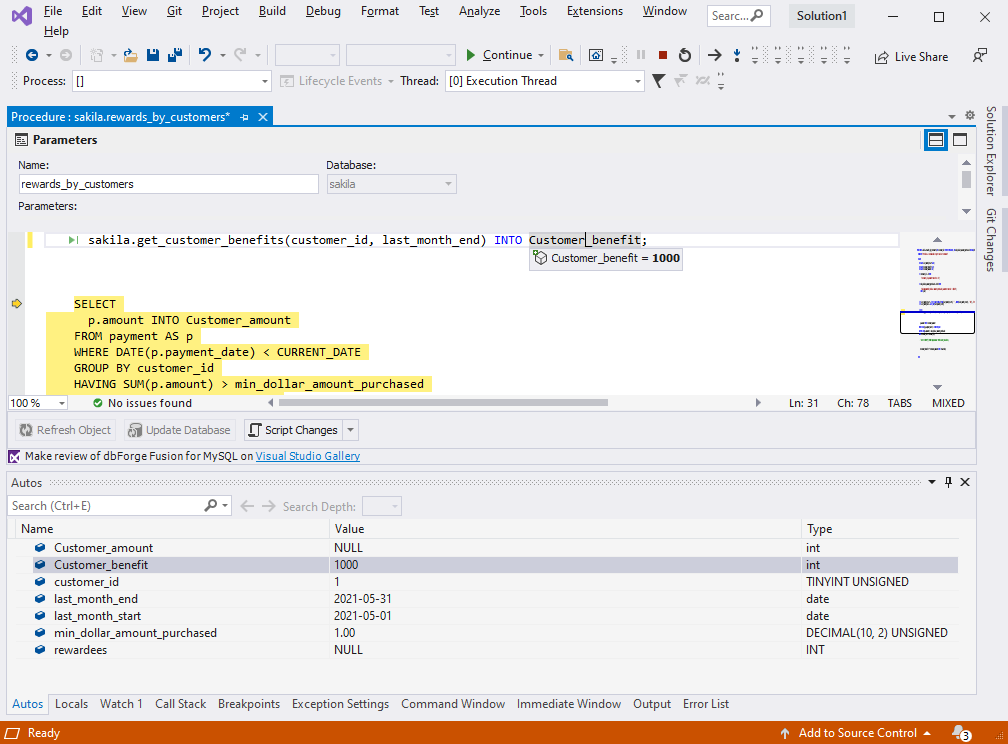
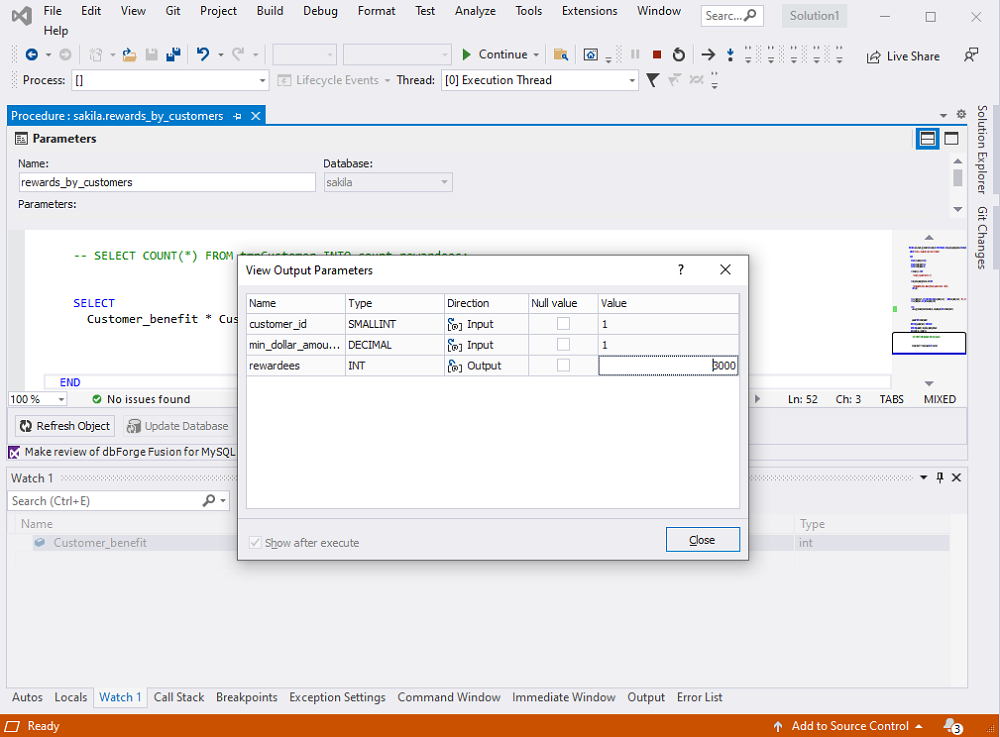
Step 5. Analyze the results
Upon the successful completion of the debugging operation, you will see a window with the value returned by the procedure.
Conclusion
Debugging is definitely one of the most tiresome parts of any database development process. Writing code can be exciting, but combing through the scripts in an attempt to find bottlenecks is far from that. That’s where a robust debugging tool would be of great help.
dbForge Fusion for MySQL is a feature-rich MySQL Visual Studio plugin offering its users mighty debugging capabilities. Try it out and bring your MySQL and MariaDB database development to a whole new level. Stop compromising on code quality right now!
