Data consolidation in Excel is what tames the wild beast of disorganized customer data. Businesses generate a lot of information on many different platforms. Think of customer data in CRMs, sales figures across ERPs, inventory sitting in cloud databases, or social media interactions tracked by various analytics tools. Without consolidation, there is just no easy way to turn this into strategic assets.
Excel makes this process much easier, allowing you to unify customer data across multiple sources with one formula. Equipped with the right add-ins, you can easily integrate, manage, and update customer data in real time. This will let you study customer behavior, find high-value segments, create targeted marketing campaigns, automate reporting, and more.
- The practical approach to customer data integration in Excel
- Types of data integration in Excel
- Preparing your data for consolidation
- Using Excel Add-ins for data consolidation
- Step-by-step Guide to data consolidation in Excel
- Conclusion
The practical approach to customer data integration in Excel
Excel is much simpler and more affordable than full-blown ETL software solutions, especially for smaller organizations that don’t need all this heavy functionality.
Let’s say you run an e-commerce business selling through Shopify and tracking customer interaction in PostgreSQL. Using tools like Devart Excel Add-ins, you could directly connect to both and import all relevant data into a single spreadsheet following a simple wizard. Once inside Excel, you can find current purchase patterns and inventory turnover rates in real time.
Similarly, if you are an inventory manager for a retail chain using Magento and SQL Server, you can use that same Add-in to pull your point-of-sale and inventory information into one unified Excel dashboard. After making changes, you can update your data to Magento and SQL Server without complicated interfaces or long setup times.
Hands-on benefits of customer data integration in Excel
- Ease of Use: Excel allows quick and straightforward data handling, ideal for users who prefer a manual approach.
- Flexibility: Integrate data from various sources, perform custom calculations, and then re-upload the updated data back to the original or new sources.
- Speed: Excel’s familiar environment speeds up the data integration process, reducing the time needed to combine and analyze customer information.
- Data Accuracy: You can easily clean, validate, and standardize various formats using straightforward functions and formulas right in Excel.
- Customer Behavior Analysis: Excel makes analyzing customer data and patterns easy in one clear view for faster reporting.
- Improved Decision-Making: Having all your data in one Excel sheet allows you to discover new opportunities, predict future sales trends, and stay at the forefront of industry developments.
- Targeted Outreach: Excel lets you segment your audience based on their preferences so you can create personalized marketing campaigns.
Types of data integration in Excel
There are three types of data integration available in Excel. These include consolidation, propagation, and federation.
- Consolidation: Bringing data together from different sources into one place, like a single Excel sheet or workbook. This is the most common type and the one we will be covering. It’s ideal for streamlining your data storage, so you don’t have to dig through multiple sources.
- Propagation: Automatically copying data from one place to another. For example, between different Excel sheets or workbooks. If you refresh the source data, the linked cells will automatically update. It’s great if you have a few key data sources — you can update quickly without having to merge everything.
- Federation: Accessing and querying data from multiple sources without physically combining them. Excel does not natively support this, but it’s possible with the help of an appropriate add-in. It works well for companies managing vast datasets that need real-time insights.
Whichever you go with, Excel lets you integrate various types of customer data, including names, contact details, demographics, purchase history, order timestamps, and email or website interactions. These can be in a text, number, date, JSON, or XML format.
Manual data consolidation in Excel
Instead of relying on cumbersome ETL processes and coding, you can achieve data consolidation in Excel with just a few clicks. Simply follow these steps:
- Open a new Excel workbook and import your data from CSV or Excel files.
- Create a new sheet for consolidation, such as Consolidated Data, and add headers for the combined data.
- Copy relevant data from each source sheet into the consolidated sheet and remove duplicates.
- Use the VLOOKUP formula to retrieve and calculate the values you need from the original datasets.
The problem in the manual method is that any changes in the original data source will not be reflected in Excel. If your underlying data refreshes, your consolidated sheet won’t update automatically. That’s why it’s better to use Excel Add-ins. They let you pull data into Excel in real time, so you don’t have to worry about it being outdated by the time you upload it.
Fetching and uploading data between sources
There are other ways you can use Excel to fetch, alter, and upload data. Excel allows you to import data directly from various databases such as SQL Server and Microsoft Access. You can pull in data from CRM systems, e-commerce platforms, and customer support tools such as Zendesk. For instance, for customer support, this begins with a Zendesk export in CSV format before consolidating in Excel, unless you’re using Add-ins for direct connections.
Excel also contains plenty of built-in tools and formulas for cleaning and standardizing your data. What’s more, turning your data into meaningful insights is pretty easy using features such as Pivot Tables. When you’re finished, you can combine datasets based on common fields and refresh the updated data to its source in just a few clicks.
Preparing your data for consolidation
Before consolidating, you first have to identify, gather, and clean all the data you need from the relevant sources.
Identifying data sources
Determining what type of data sources you have to work with is essential to achieve your goals. For example, you may need customer data from a CRM (like Salesforce) and transaction records from a cloud platform (like SQL Server) to get useful insights about customer behavior and conversion rates.
Other common data sources include:
- CRM systems: HubSpot, Zoho, Microsoft Dynamics.
- E-commerce platforms: Shopify, Magento, BigCommerce.
- Accounting software: QuickBooks, NetSuite, FreshBooks.
- Marketing platforms: Mailchimp, Marketo, Salesforce Marketing Cloud.
- Cloud databases: DB2, PostgreSQL, MySQL, Oracle Cloud.
- Analytics tools: Zendesk, Freshdesk.
Cleaning and standardizing data
Data from different sources often comes in inconsistent formats, leading to errors. To make sure your data is accurate, here are some best practices to follow:
- Check for and remove any duplicate entries in your dataset.
- Make sure that data formats are consistent, such as dates being in the same format, like MM/DD/YYYY.
- Handle missing values, either filling in gaps with default values, interpolating, or removing records that are incomplete.
- Apply Excel functions such as TRIM to remove extra spaces, CLEAN to remove non-printable characters, and UPPER/LOWER for standardizing text cases.
- Use conditional formatting to point out any anomalies or outliers.
Using Excel Add-ins for data consolidation
Excel Add-ins are essential tools that help overcome data integration problems by extending Excel’s capabilities to connect with diverse data sources smoothly.
Overview of Excel Add-ins
Excel Add-ins can make data consolidation and other processes easier, connect with more external data systems, and improve how you import, analyze, and visualize data. They also help with complicated calculations and data changes, simplifying data management and reporting.
Popular Excel Add-ins for data integration
There are plenty of add-ins for Excel data consolidation out there. The right one depends on your specific needs and the complexity of your data.
Take a look at the most popular options below.
| Add-in | Description |
|---|---|
| Devart Excel Add-ins | Connects Excel to most popular cloud platforms like Quickbooks, HubsSpot, and Mailchimp, as well as major databases, allowing for instant data integration, management, and analysis. |
| XLTools | Offers features for merging, cleaning, and analyzing data directly within Excel. |
| Ablebits Data Tools | Provides a suite of tools for data cleaning, merging duplicates, and advanced filtering. |
| Fuzzy Lookup Add-in | Helps match and merge records from different datasets based on similar text values. |
Step-by-step guide to data consolidation in Excel
Now, suppose you want to consolidate sales data from SQL Server with customer interaction data from HubSpot to create targeted email campaigns. We have already covered how to do it manually, but let’s find out how to make the process more efficient.
Here’s how to add Devart Excel Add-ins to consolidate customer data:
Note: The steps below can be applied to work with various cloud platforms, databases, or any other data sources you use that the Devart Add-ins support.
Connecting to data sources
Install the Devart Excel Add-ins
Download the Devart Excel Add-ins Universal Package. Then, run the installer and follow the instructions in the Setup Wizard.
Open Excel
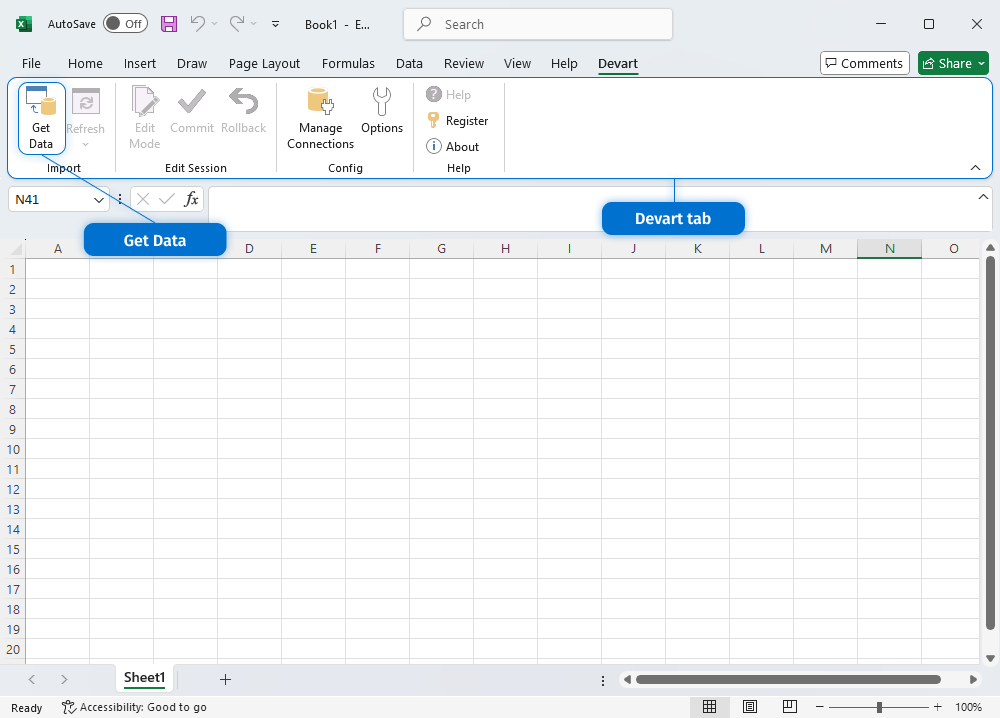
After installation, launch Excel and navigate to the “Devart” tab.

Connect to your database
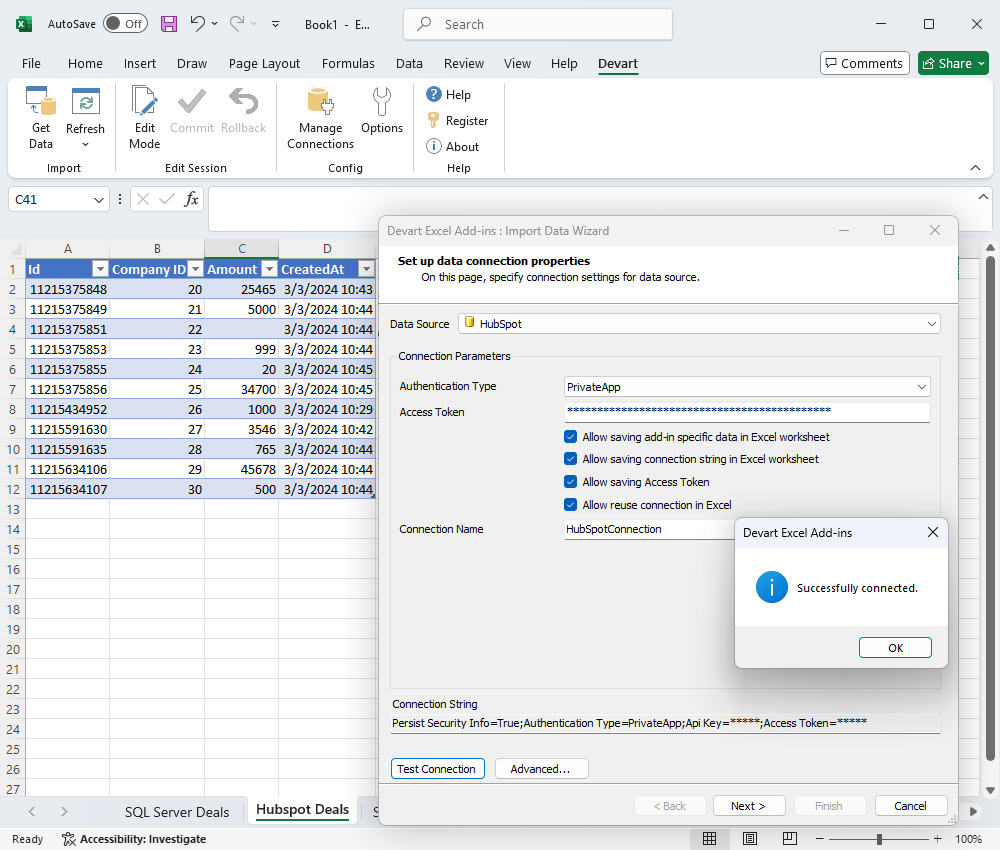
For this example, select “Get Data.” This will open the Import Data Wizard. In the Data Source dropdown, select SQL Server Database. Enter your server name and database credentials, then click “Next.” Follow the instructions to import the data.

Connect to the cloud platform
Click on “Get Data” again, but this time select HubSpot as your data source. Enter your HubSpot API key, and follow the instructions to import your data.

Merging data sets
With both datasets in different worksheets, follow the steps to manually consolidate data in Excel, as mentioned above. That is, create a new sheet, copy and paste both sheets’ relevant columns, and then clean up the data by removing duplicates and inconsistencies.
Then, you can merge them using either Excel’s VLOOKUP function or the Consolidate tool.
Using Excel’s Consolidate
Suppose you want to consolidate multiple rows in a spreadsheet, such as customer data with repeated IDs but different purchase histories. Here’s how to combine them to get the total purchases per customer:

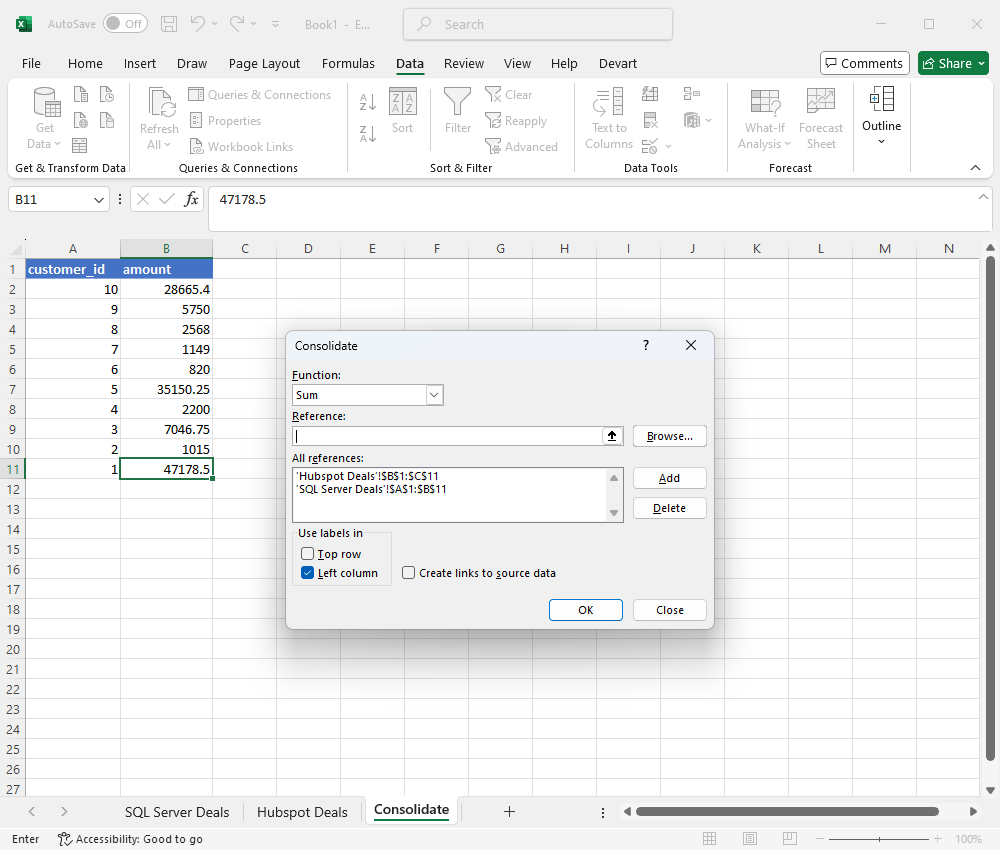
- Head over to the Data tab and choose Consolidate.
- In the dialog box, pick the SUM function and select your data ranges.
- Hit the Add button, check the Top row or Left column boxes depending on depending on where your labels are located. In this case, select the second to get the purchase amounts with the same customer ID, and click OK.
If your data spans multiple ranges (e.g., Q1 sales data in one range and Q2 sales data in another), the consolidation process is similar. However, make sure to select both Top row and Left column to ensure accurate aggregation.
When your sales data is in different spreadsheets, just switch to each sheet, highlight the ranges you want to include, and click Add in the Console box.
Want to consolidate data from multiple workbooks instead? It’s pretty much the same process. Just open both workbooks (for example, Q1 Sales.xlsx and Q2 Sales.xlsx). Then, follow the steps outlined earlier, but switch between the two workbooks to highlight the ranges you want to consolidate.
Using the VLOOKUP function
Excel’s VLOOKUP’s formula is a better fit for those cases when you need to get specific information from different tables, especially when dealing with large datasets. It’s important to note, though, that it can only return values from one column at a time, so it won’t work for multiple row and range consolidation.
Now, let’s say you want to consolidate sales data from Sheet1 and customer interaction data from Sheet2. You can use the following formula:
=VLOOKUP(A2, Sheet2!$A:$D, 2, FALSE)In this formula:
- A2 is the value you want to search for, such as a customer ID.
- Sheet2!$A:$D is the range you want to search in.
- 2 tells Excel that you want to return the second column of that range.
- FALSE indicates an exact match.
In this example, if you want to retrieve only the “Converted” status, you’d have to modify the formula to:
=IF(VLOOKUP(A2, Sheet1!$A:$D, 3, FALSE)="Converted", "Converted", "")In the next empty column in your consolidated sheet, use:
=IFERROR(SUMIF(Sheet2!$B:$B, A2, Sheet2!$E:$E), 0)Learn more methods to set up an Excel Oracle database connection in this article.
Conclusion
Data consolidation in Excel is ideal for anyone managing diverse datasets, especially when it comes to customer information across multiple platforms. With the right add-in, you can simplify your data handling and make your workflow much smoother. Try Devart Excel Add-ins to easily connect to various databases and cloud services, streamline your data import processes, and refresh your data in real time with just a click.


