
Working with databases involves dealing with a substantial amount of data. Every day, database administrators face challenges on how to analyze and summarize this data. Pivot tables can assist in solving this “brainteaser” and improve the efficiency of data analysis and reporting.

In this article, we are going to demonstrate how to easily create a pivot table with the help of the Pivot Table Designer feature delivered by dbForge Studio for SQL Server. Additionally, we’ll show how to filter results and create a pivot chart.
Contents
- What are the advantages of using pivot tables?
- Build a pivot table with Pivot Table Designer
- Filter results in a pivot table
- Create a chart based on values from a pivot table
- Conclusion
What are the advantages of using pivot tables?
A pivot table is a powerful tool for aggregating, organizing, grouping, or extracting insights from complex datasets. It allows you to structure large volume of data and display it in a plain and easily understandable form.
Let’s review cases when pivot tables can be very efficient:
- Summarize data: With pivot tables, you’re able to summarize data through
SUM,COUNT,AVERAGE, etc. - Restructure data: Pivot tables convert data from a long format (rows) into a wide format (columns).
- Facilitate cross-tabulation: You can compare data across different variables.
- Reduce manual work: Pivot tables automate the process of data reorganization and reduce the need for manual data manipulation.
- Establish consistent reporting: Pivot tables help arrange a standardized reporting format for different team members.
- Interact directly: You can click, drag and drop elements while creating a pivot table. This process is very dynamic and simple.
- Filter data: For quick navigation through data values, there are different types of filters in pivot tables.
- Present results in an organized manner: Pivot tables provide the possibility to format and customize their appearance. This enhances the clarity of the displayed information.
In summary, pivot tables come in handy when you work with extensive datasets and you need to analyze and visualize this information in a more efficient way. These characteristics make pivot tables an indispensable tool for specialists in various fields.
Build a pivot table with Pivot Table Designer
Imagine we have a query that returns the names of salespeople, goods, brands, product categories, and total sales numbers per each salesperson.
SELECT
	CONCAT(s.first_name, ' ', s.last_name) AS sales_person
   ,c.category_name
   ,b.brand_name
   ,p.product_name
   ,o.order_status
   ,o.order_date
   ,FORMAT(oi.quantity * oi.list_price - oi.quantity * oi.list_price * oi.discount, '0.#0') AS total_sale
FROM sales.order_items oi
INNER JOIN sales.[orders] o
	ON oi.order_id = o.order_id
INNER JOIN production.products p
	ON oi.product_id = p.product_id
INNER JOIN production.brands b
	ON p.brand_id = b.brand_id
INNER JOIN production.categories c
	ON p.category_id = c.category_id
INNER JOIN sales.staffs s
	ON o.staff_id = s.staff_id;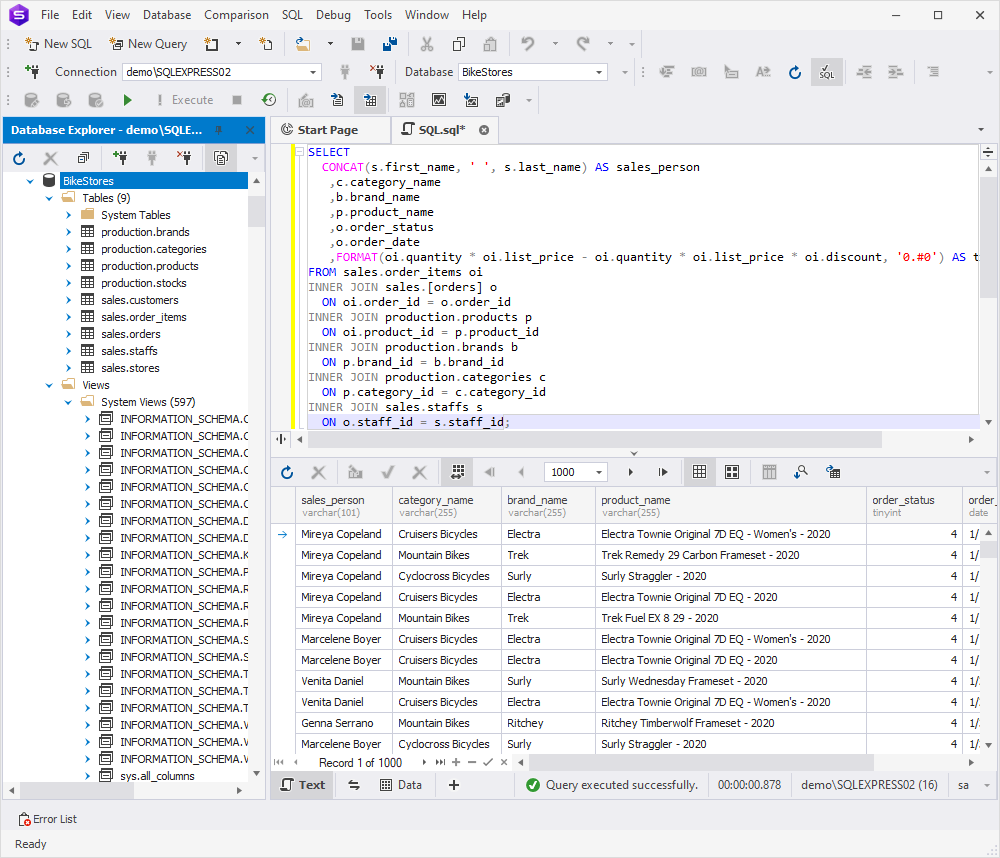
However, there is a little nuance – data in this form in the table is hard to grasp and analyze. For better understanding and visualization of data, it’s required to convert the information into a pivot table.
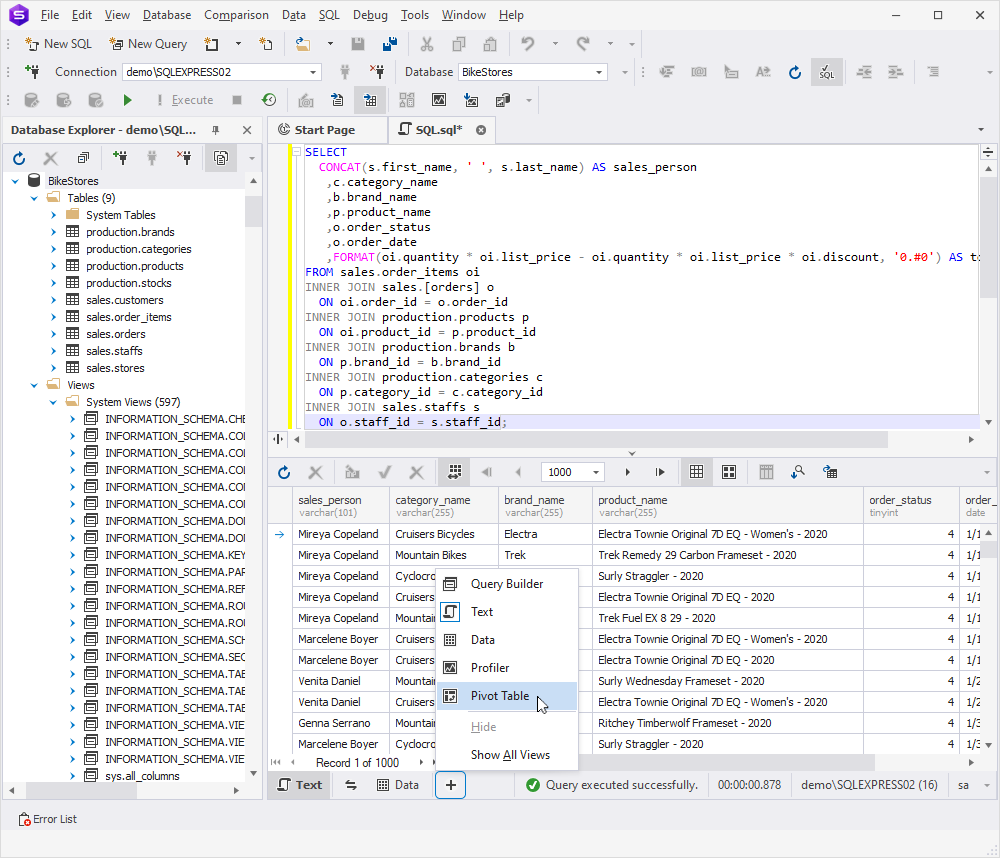
To build the table, we’ll use the Pivot Table Designer provided in dbForge Studio for SQL Server. This feature offers a wide range of options for a quick and easy table creation.
Click the plus icon and select Pivot Table.
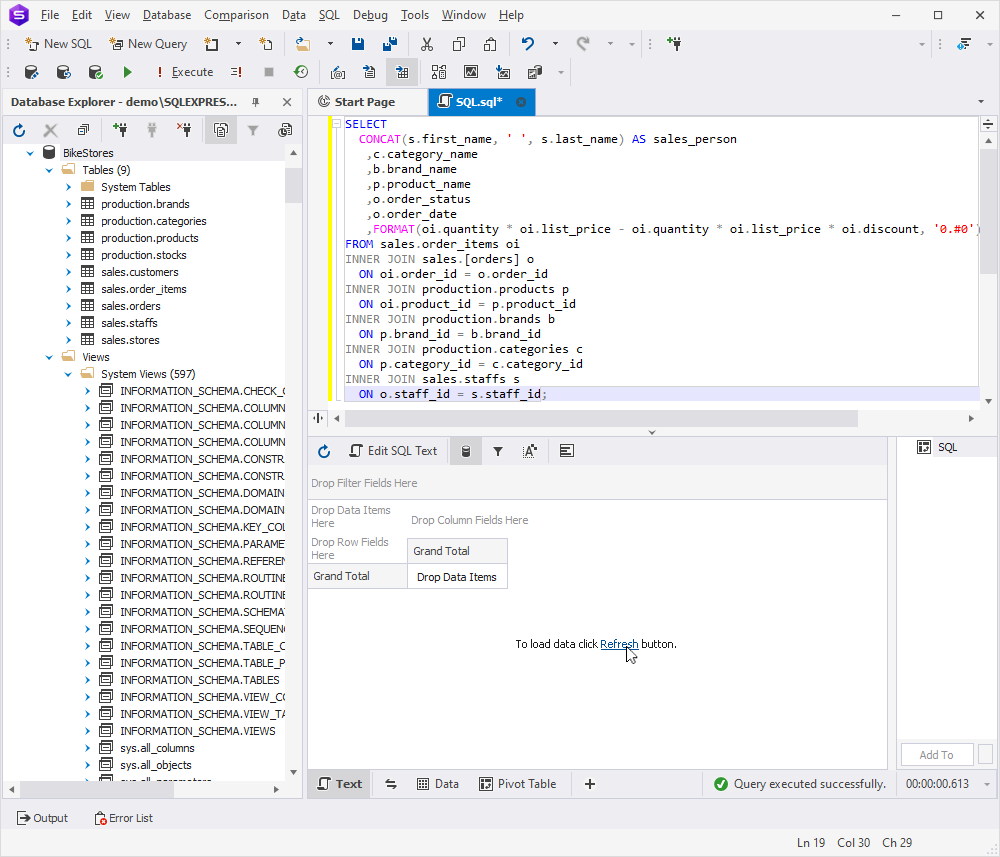
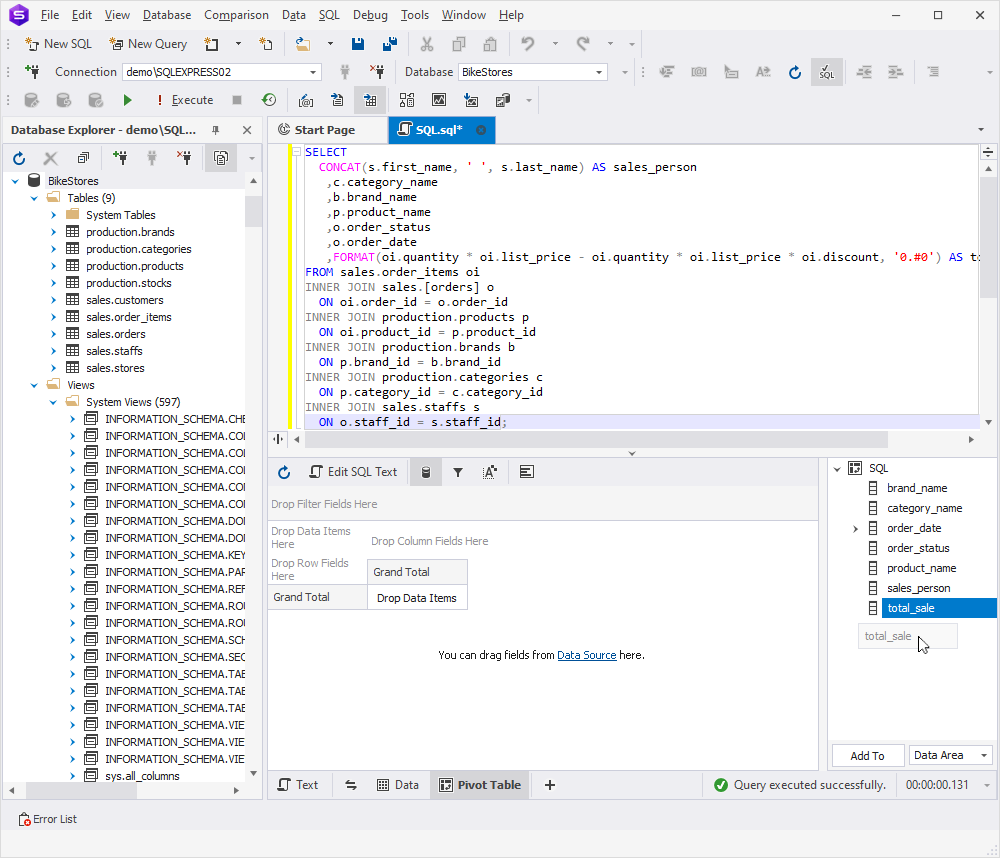
The Pivot Table Designer will open. Click Refresh for the query columns to appear on the right.
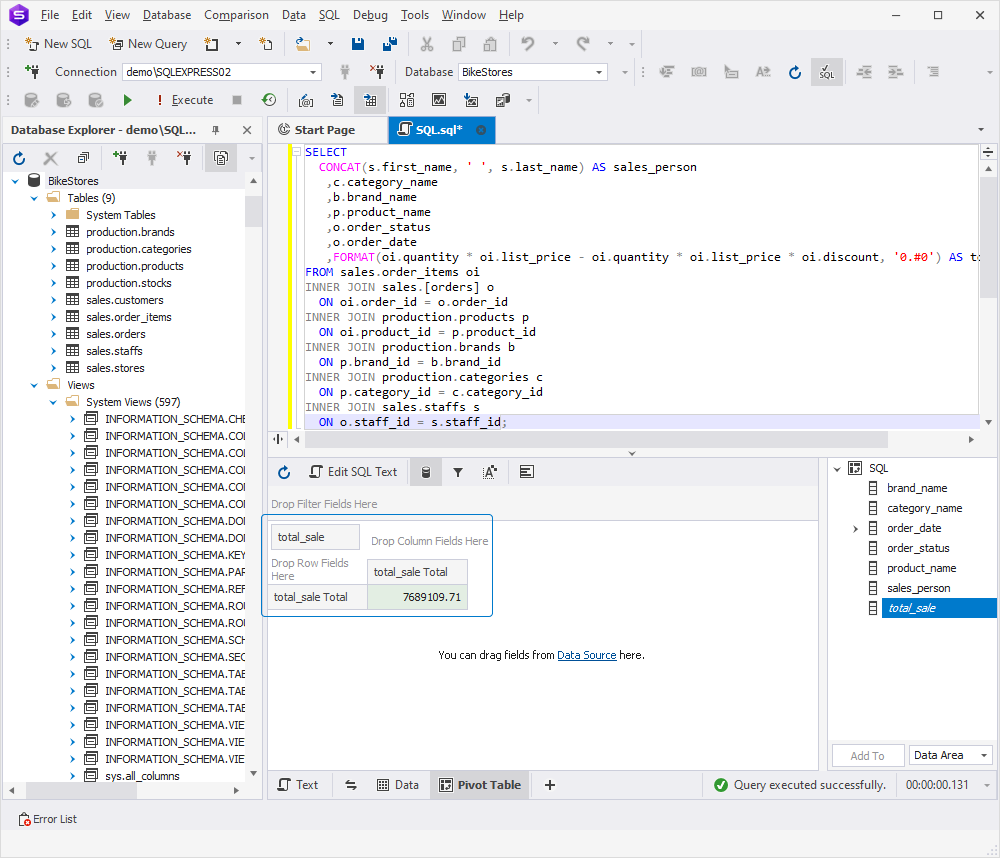
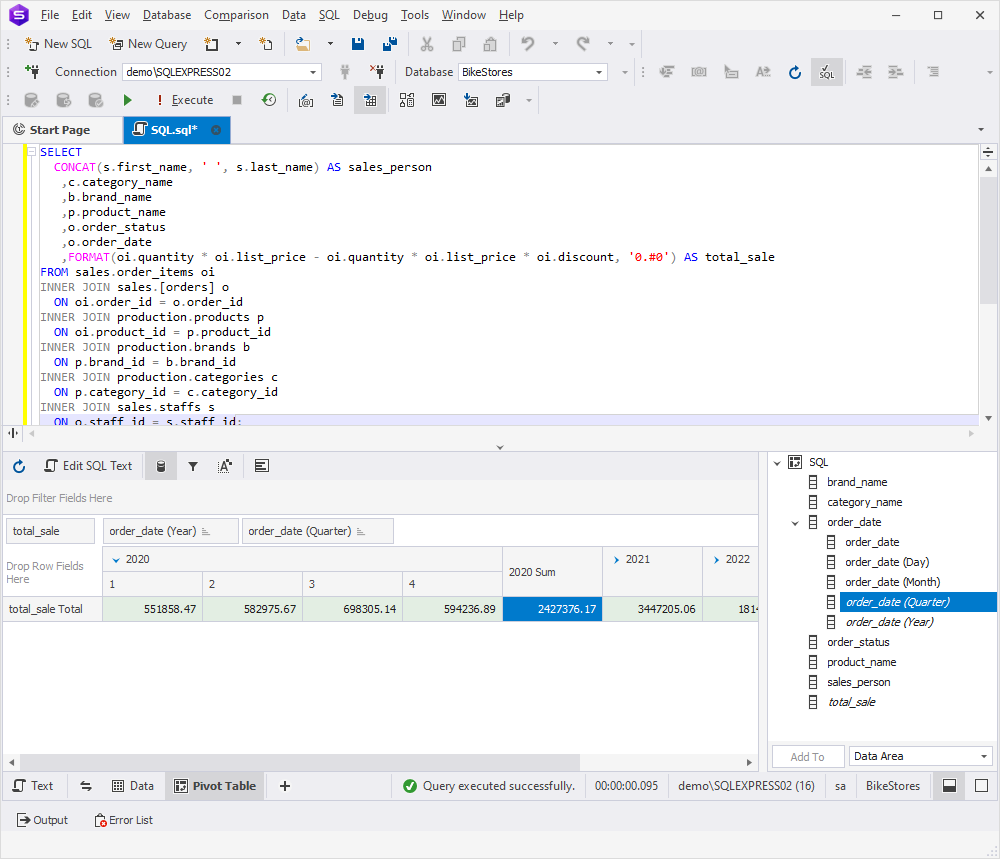
Drag the total_sale column.
And drop it into the Designer. As you can see, the total sales amount for all goods over the entire period has been calculated.
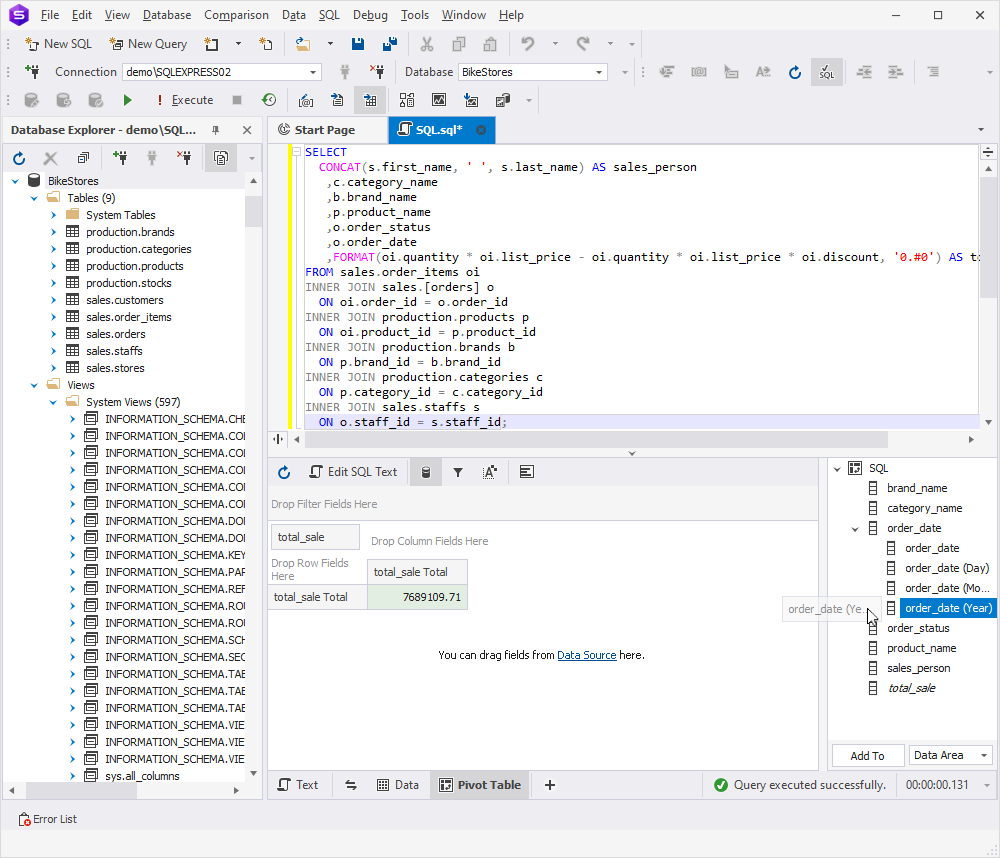
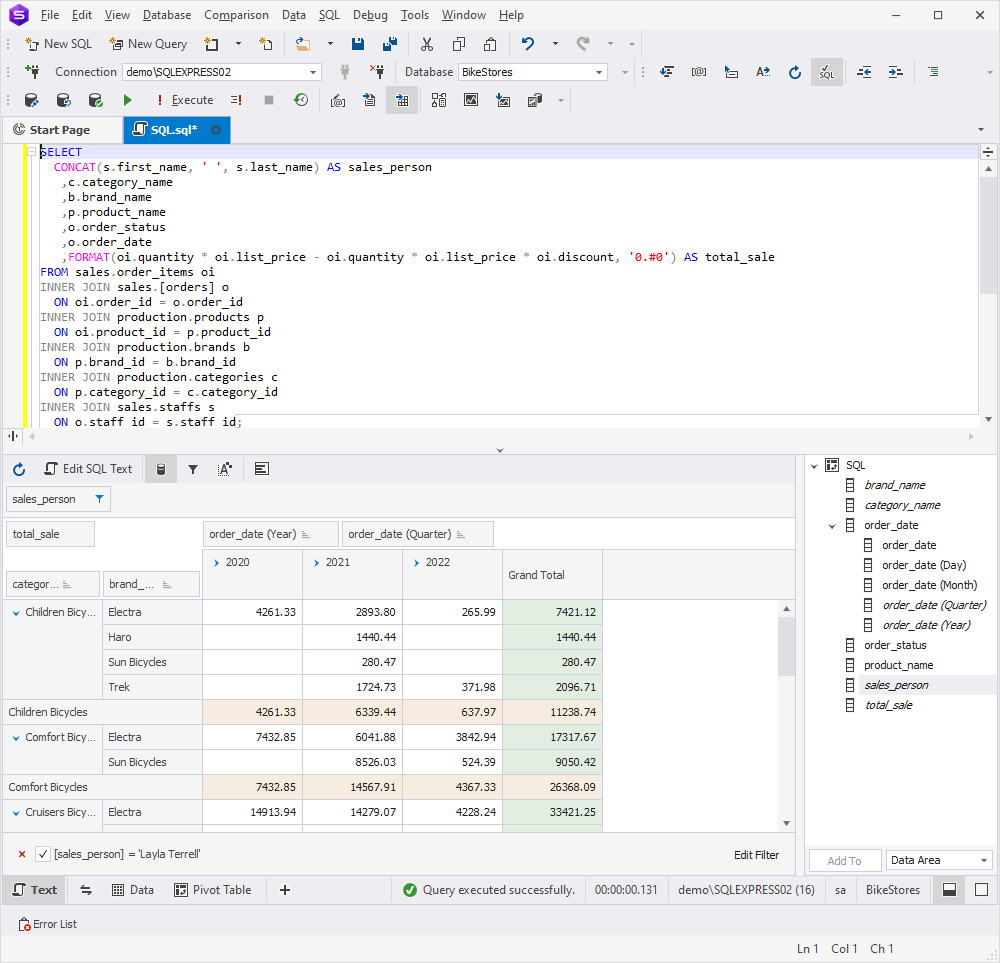
Next, drag and drop the order_date (Year) column in a similar manner.
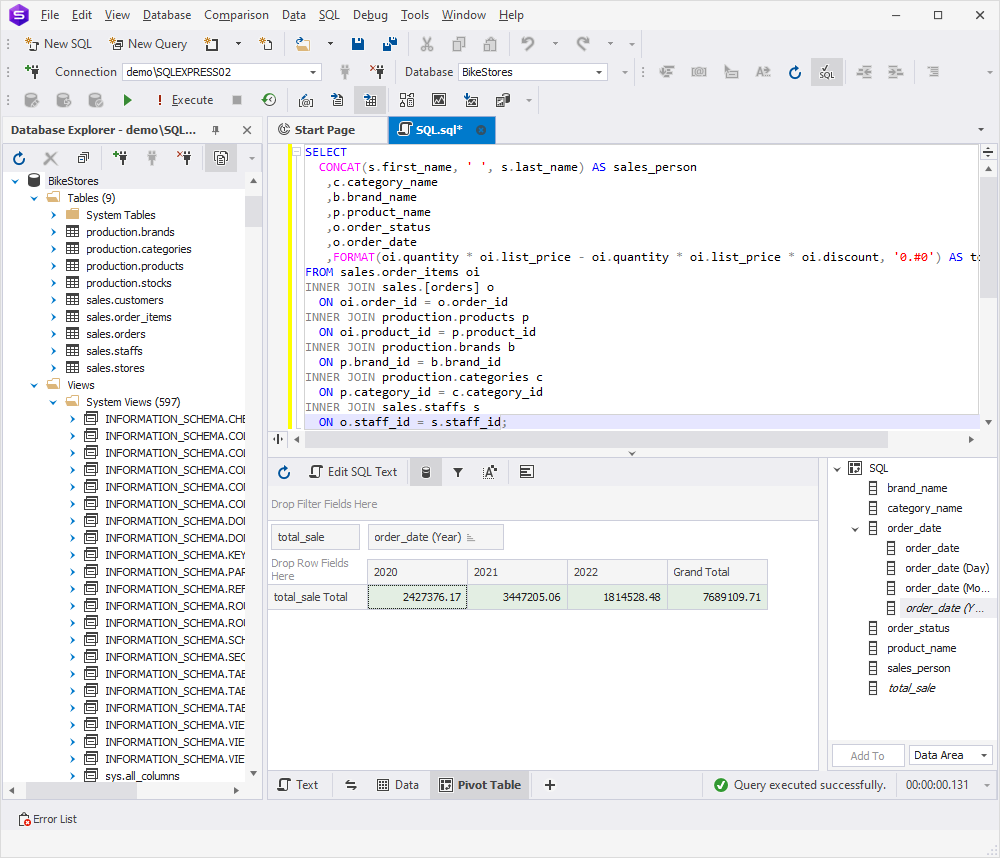
As a result, we’ll see a breakdown of the total sales amount by years.
Let’s enhance the informativeness of the data by adding more details about quarterly sales. Group all sales per quarter.
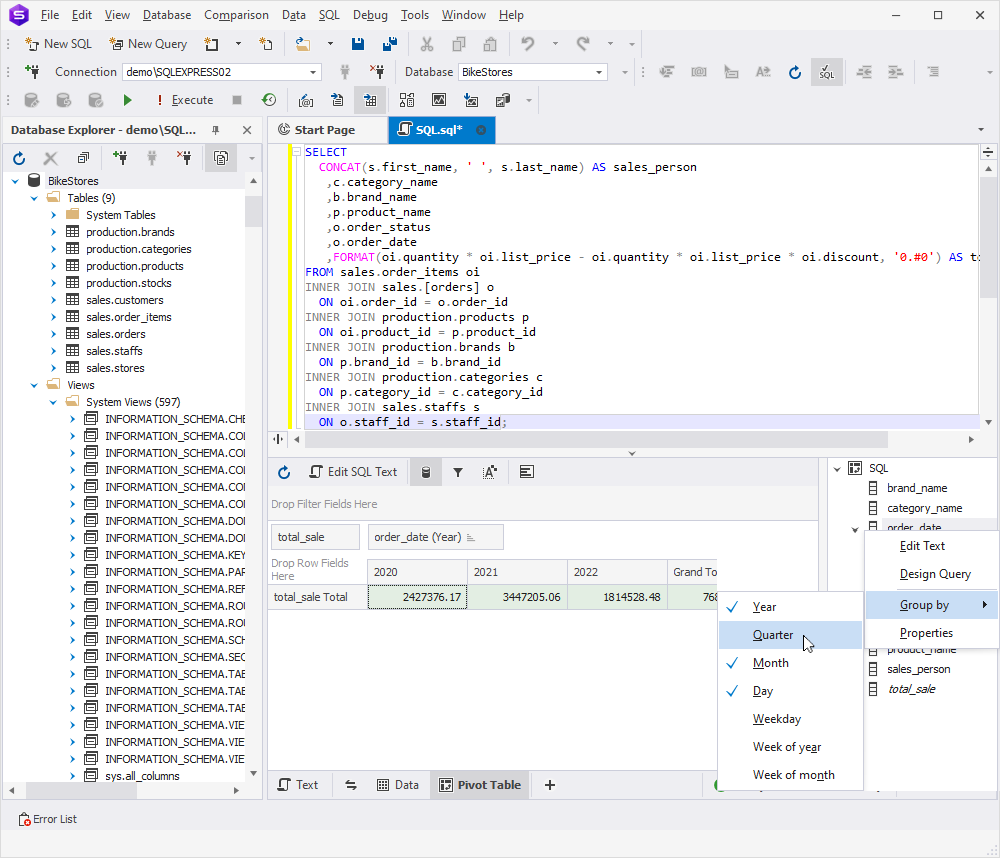
And then, drag the order_date (Quarter) column onto the Pivot Table Designer.
Do you agree that it’s much easier to perceive information in such a configuration?
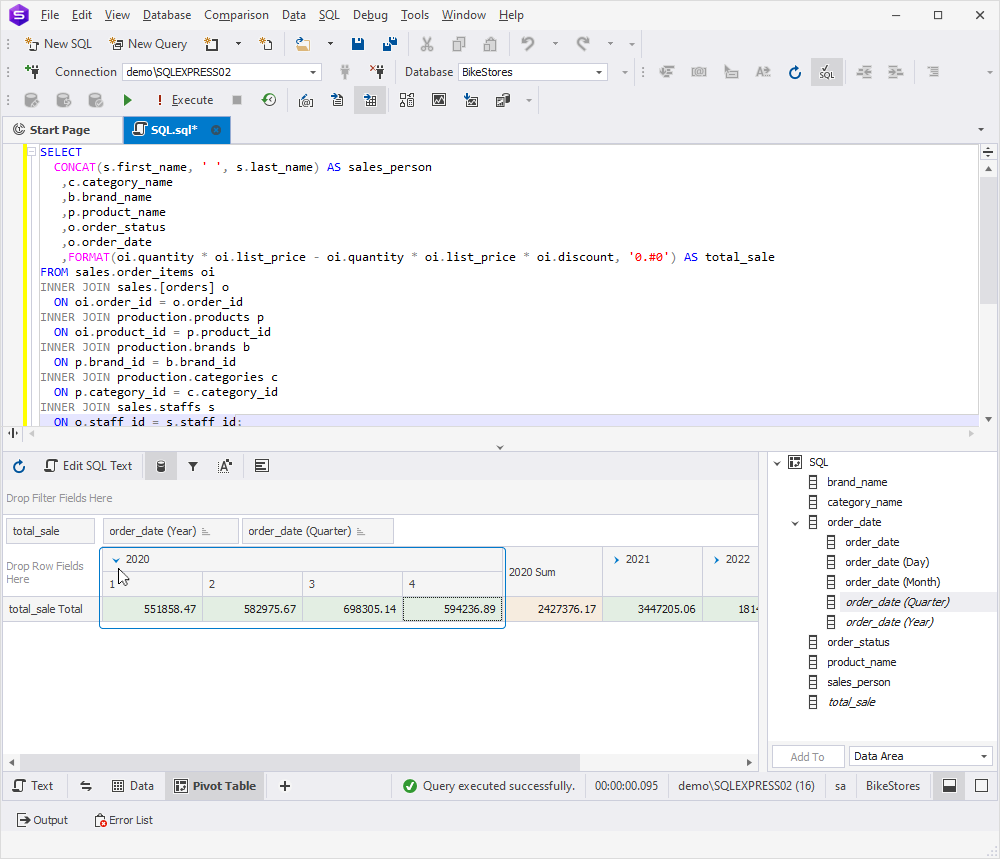
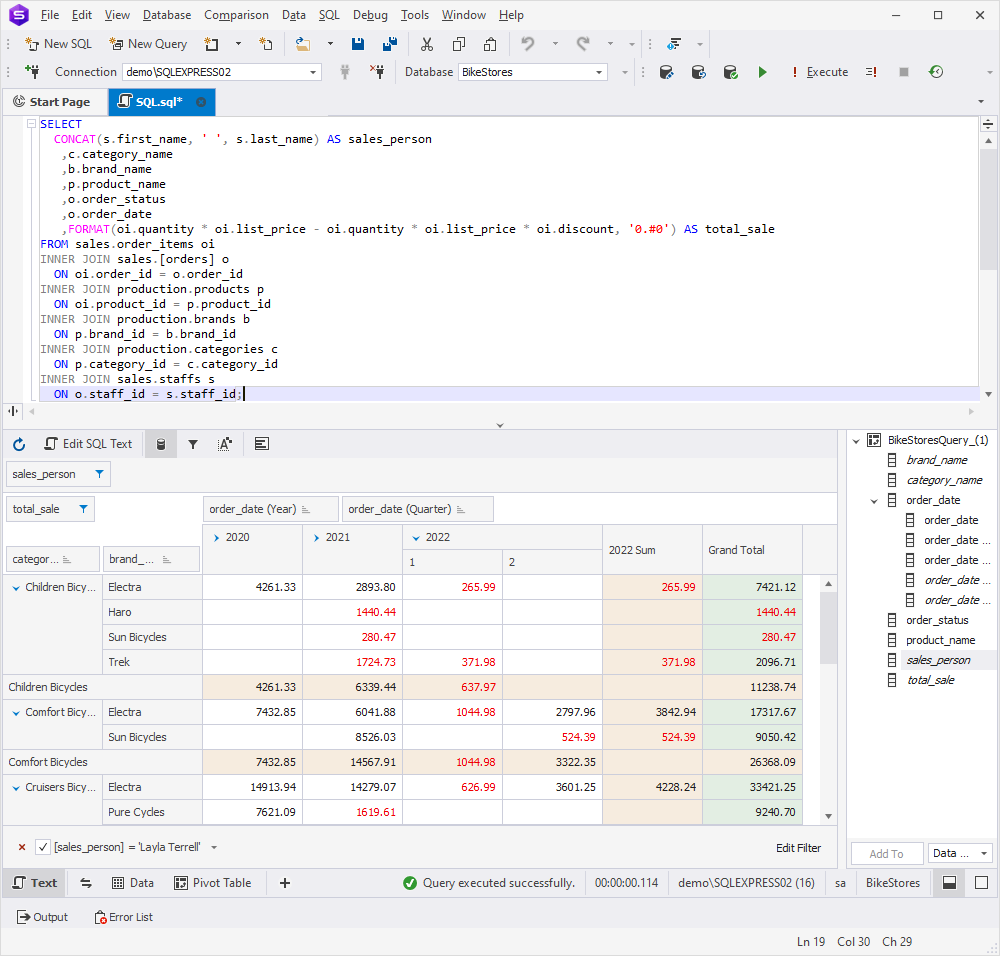
If you want to see the sales details for a specific year, you can collapse the others. For this, click the icon shown in the screenshot.
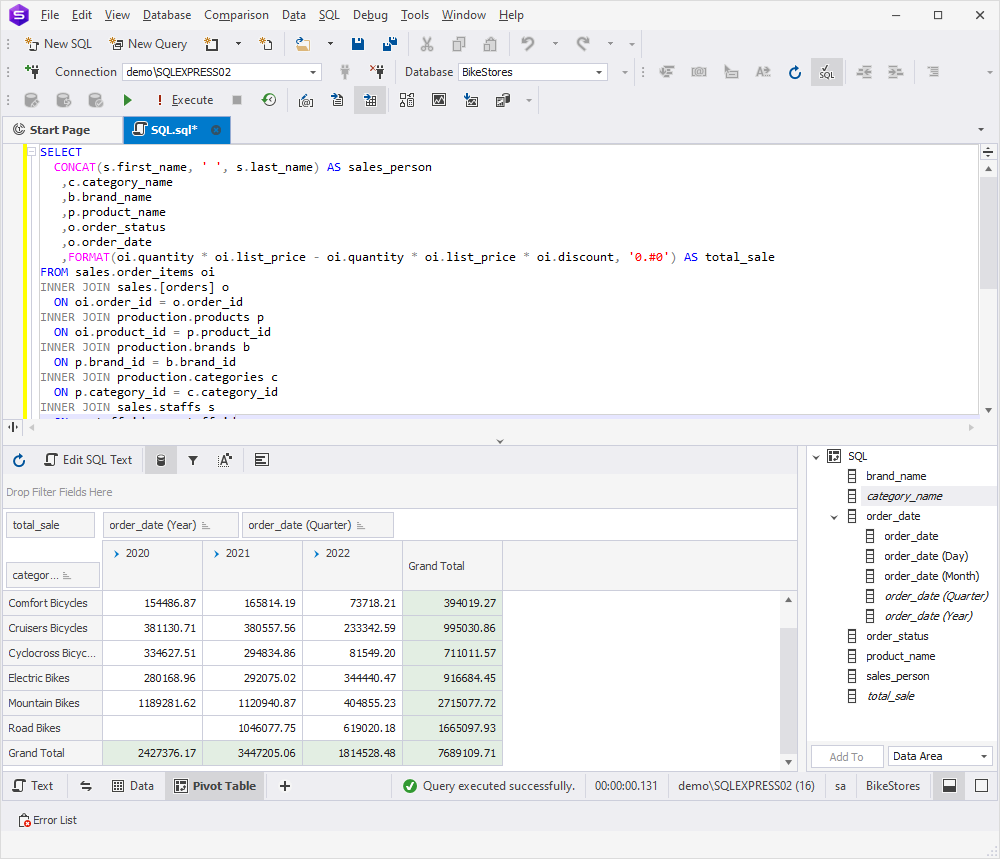
To add a breakdown by product categories, drag the category_name column into the Designer.
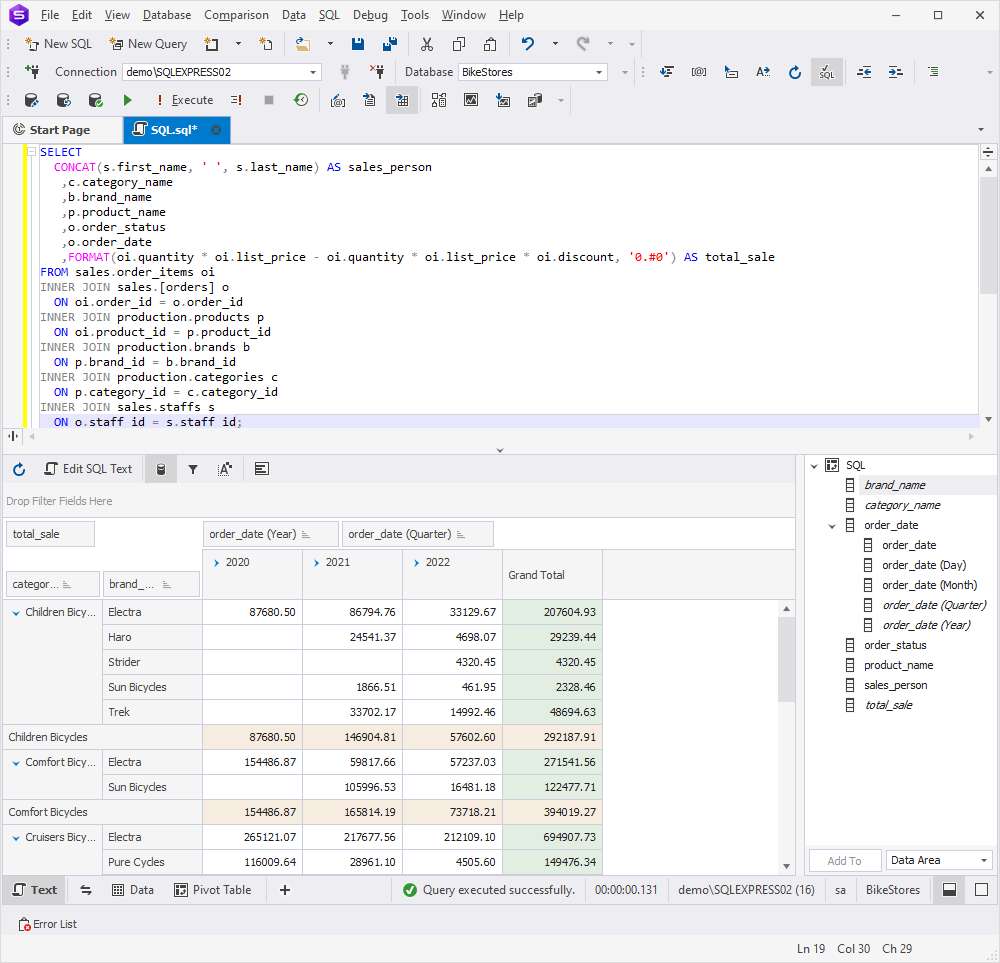
Also, we can group results by brands. To do this, drag and drop the brand_name column.
Filter results in a pivot table
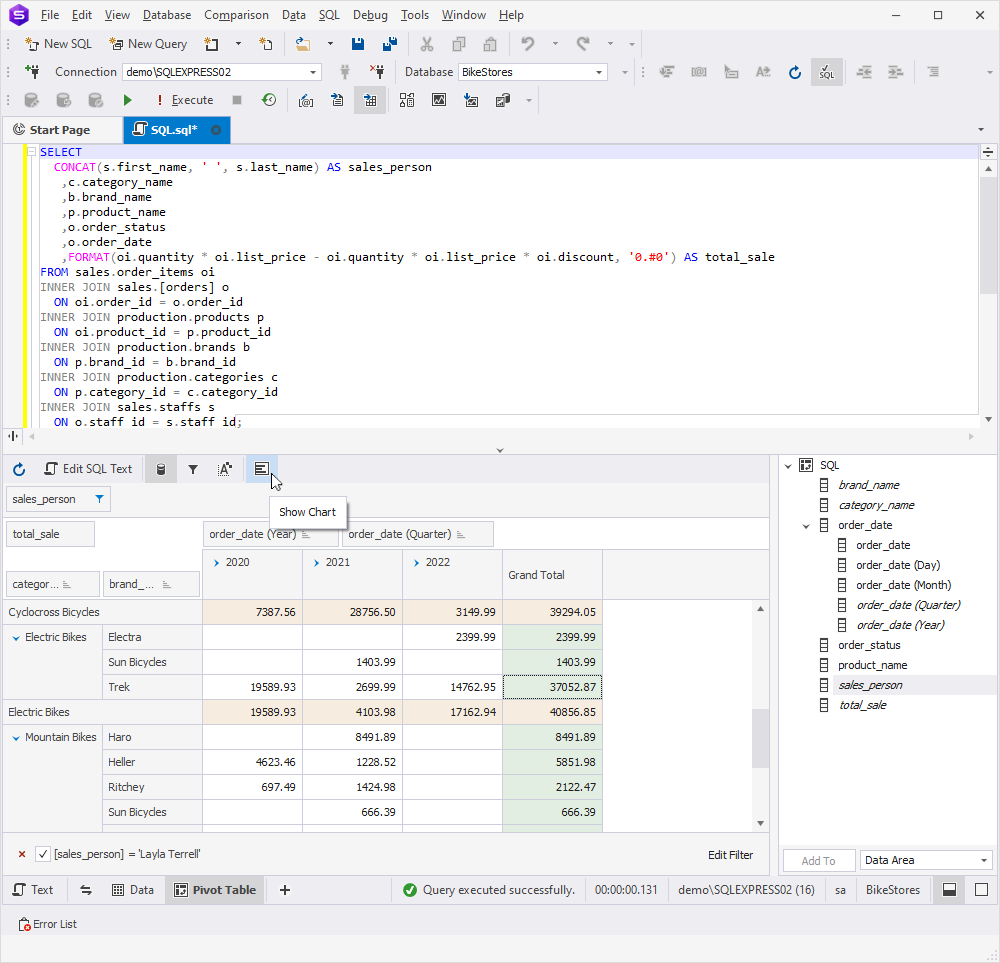
To quickly extract the required data, you can apply filters to any column in a pivot table. For example, to check sales data for a specific salesperson, drag and drop the sales_person column. Then click the filter icon and choose any name.
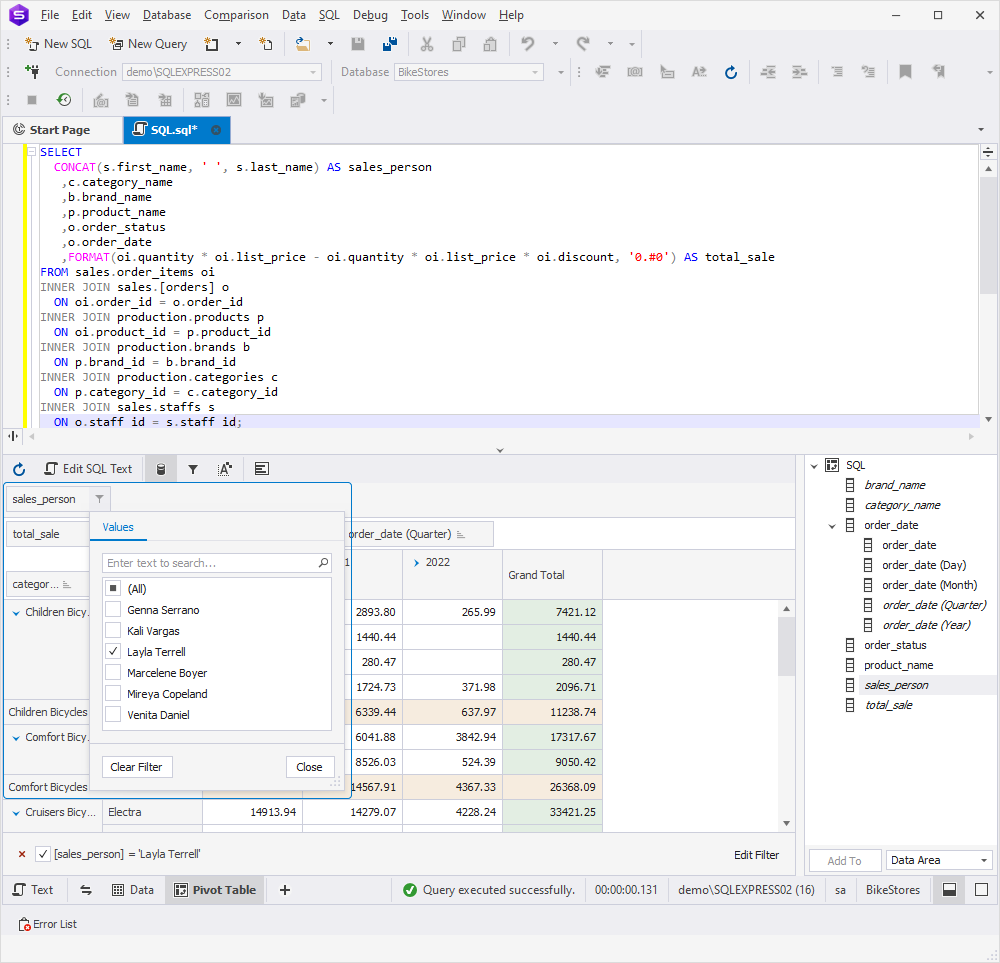
Voila! Now you can clearly see what Layla Terrell has sold, for how much, and when. And pay attention to how easily data is visualized in the pivot table. Everything is clear and straightforward.
Now, let’s quickly identify Layla’s sales that amount to less than $2000. We don’t need to waste our time visually searching for these sums. We’re going to use the conditional styles available in the Pivot Table Designer and highlight the desired values in red.
To call the context menu, right-click the grid and select Conditional Styles.
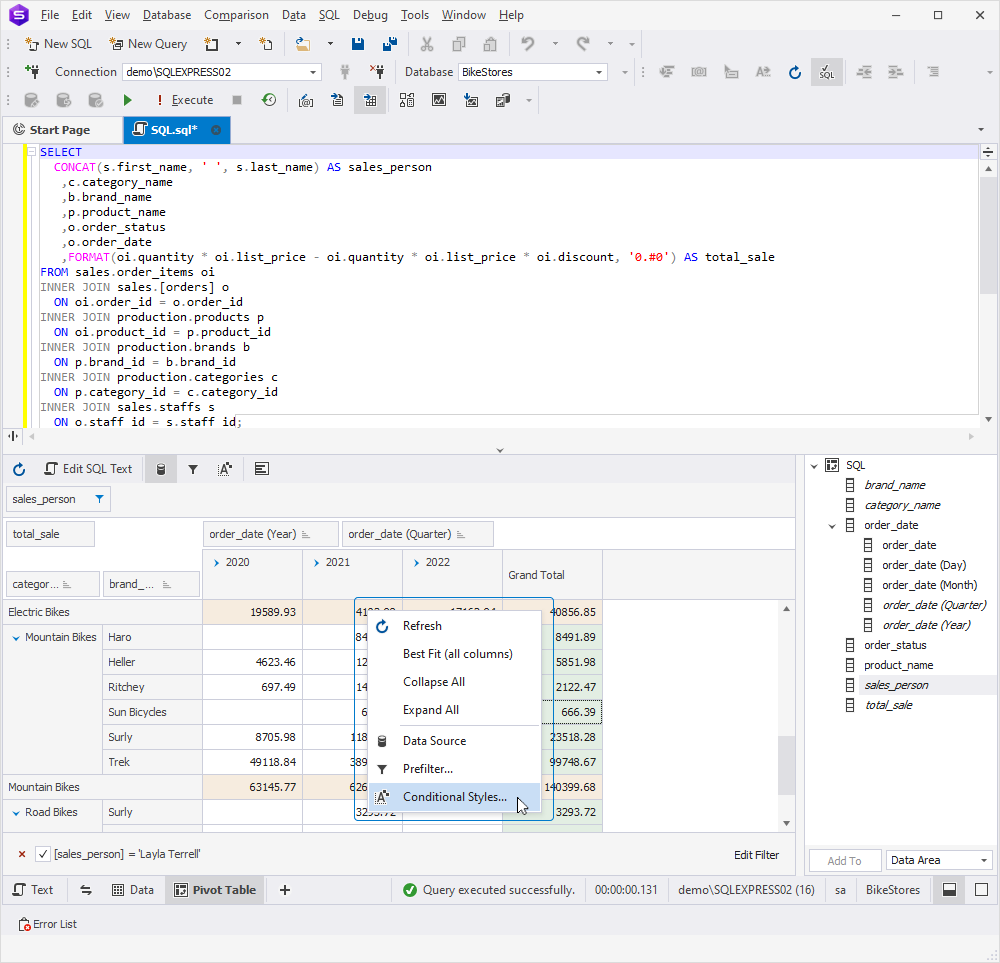
Select total_sale from Field, set Less for the Condition field, type 2000 in Value 1, and adjust the fore color. To save the settings, click OK. Perfect! That’s what we need.
Create a chart based on vales from a pivot table
Additionally, it’s possible to represent data from a pivot table in a diagram. The Pivot Table Designer provides an extensive range of chart types, guaranteeing your ability to create the specific diagram you need.
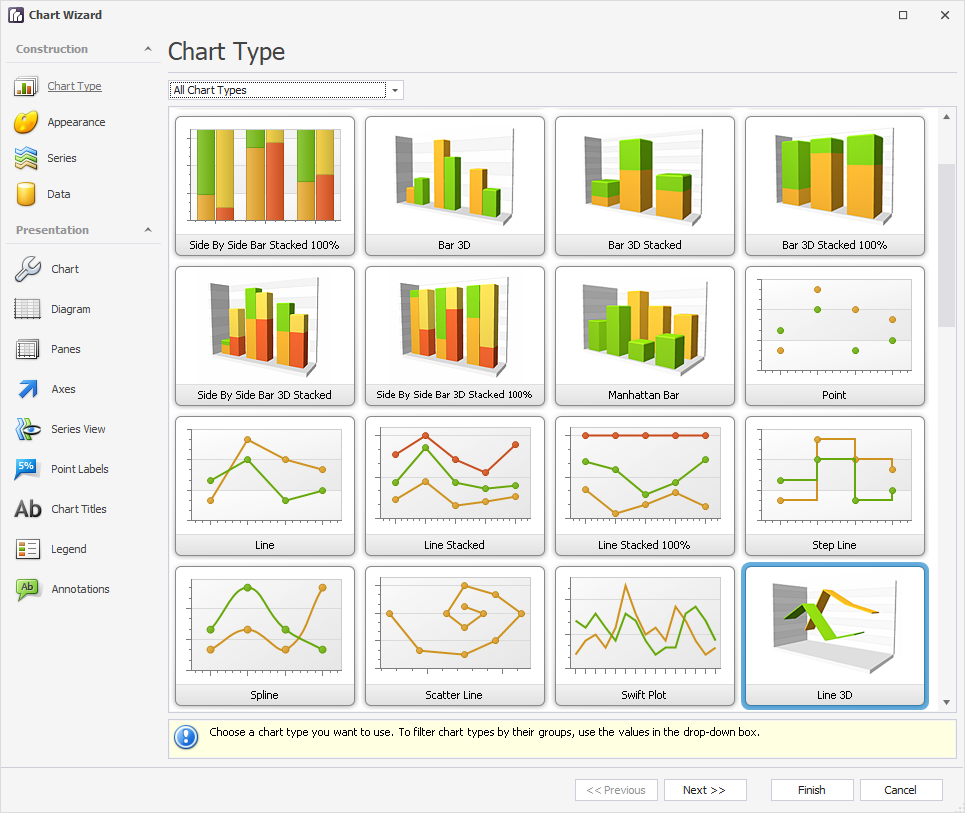
Also, there is the Chart Wizard that allows customizing literally everything related to your diagram.
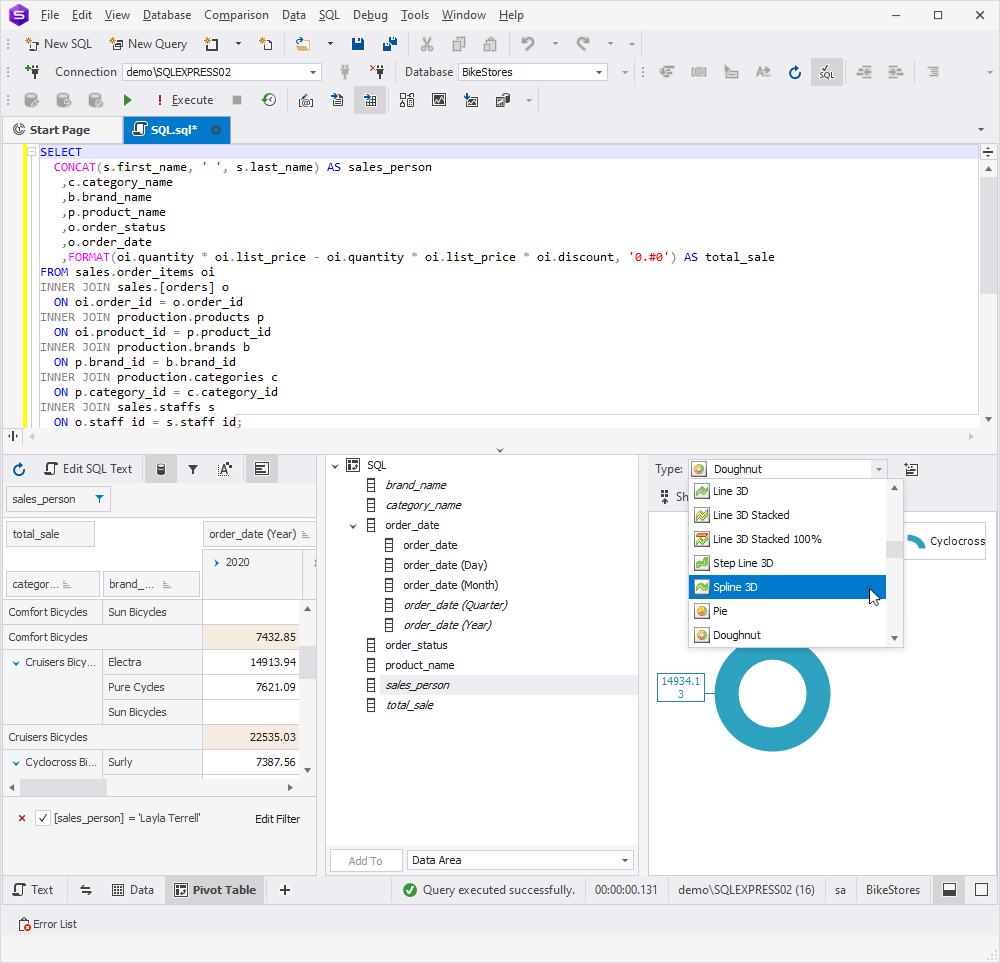
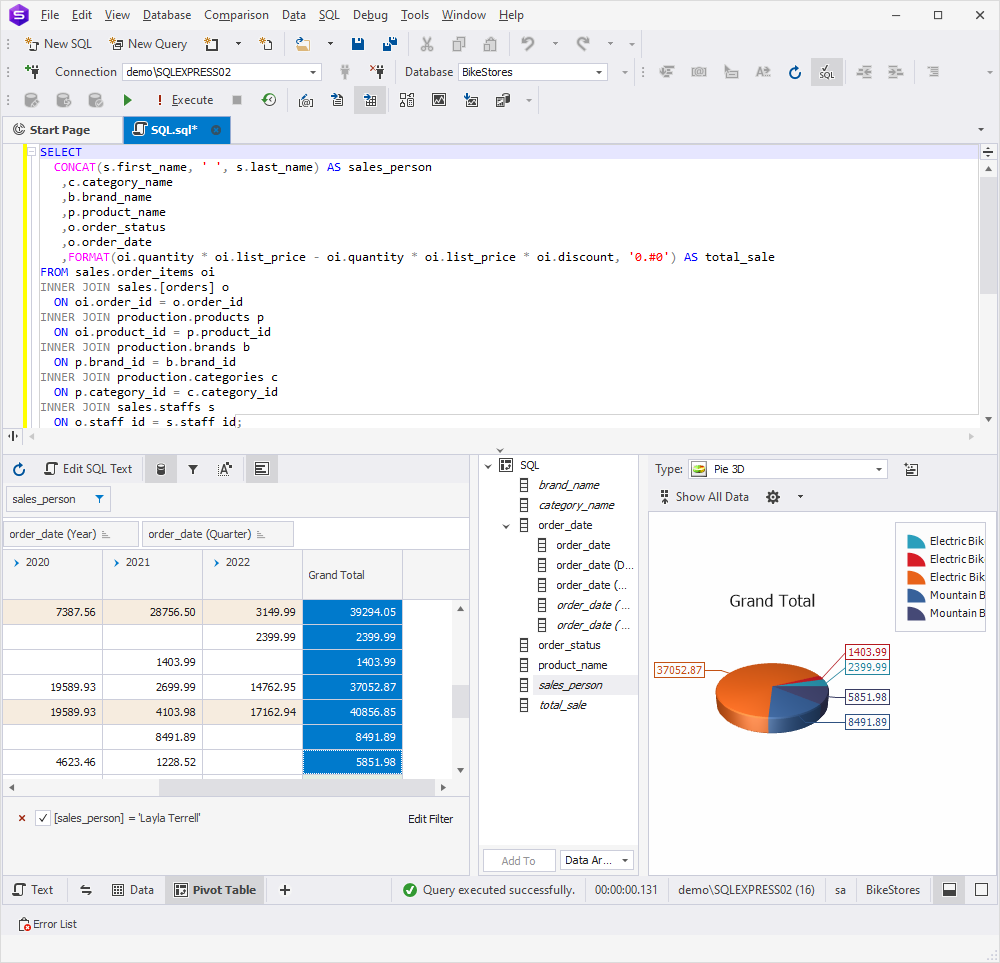
Let’s see how it works and how informative the data will look. We’ll create the Pie 3D chart based on Layla’s Grand Total sums. Click Show Chart.
Select Pie 3D from Type and select the values in the Grand Total column. That’s it, a few clicks and the chart is ready!
Conclusion
Pivot tables are an essential tool for anyone working with large datasets. They enable users to analyze and present data in a more insightful and comprehensible format. As you may have noticed, creating a pivot table in dbForge Studio for SQL Server is a straightforward process, requiring minimal time and expertise. The user-friendly design of the Pivot Table Designer makes it accessible even to those new to pivot tables. Give it a try yourself, download dbForge Studio for SQL Server and start building your tables without writing complex queries!