To get information from a database it is necessary to execute a query to get this data.
Usually an ordinary SQL editor is used to create queries. To use such editor, one should remember the syntax of the SELECT operator and the names of tables and columns.
Let’s use a visual instrument developed specially to design SQL queries, and see that it’s much easier to create SQL queries visually instead of typing them in an editor.
Task:
It’s necessary to show the salaries of the employees of departments situated in different cities for the 2008 year in descending order.
We will do this on a MySQL server database. The process of creating this database was described in the How to: Create MySQL Database in One Shot article. You can Download MySQL Demo Database (or for SQL Server Download SQL Server Demo Database).
Solution:
Let’s create an empty document in dbForge Query Builder for MySQL (dbForge Query Builder for SQL Server).
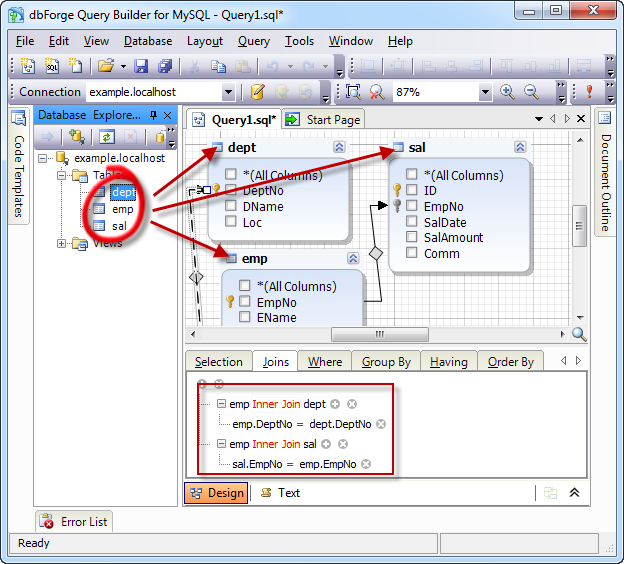
After this let’s drag tables from Database Explorer to the diagram, the order of tables during dragging doesn’t matter.
As we can see, the application joins these tables automatically.
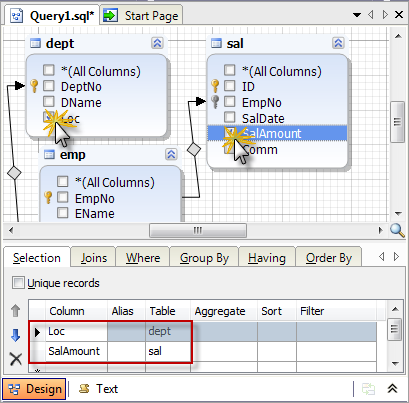
Now let’s select the columns you need to get data from.
Click the checkbox near the Loc column of the dept table on the diagram, and after that the SalAmount column of the sal table.
You can see the selected columns on the Selection tab.
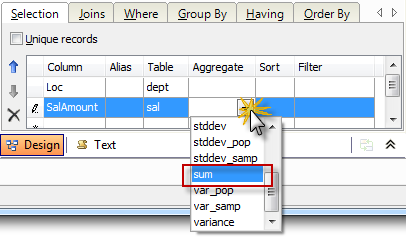
Now let’s select the sum function on this tab in the column with aggregate functions for the SumAmount column.
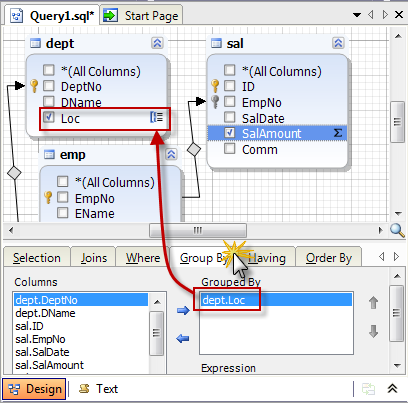
Now it is necessary to set grouping by the Loc column, but the application selected to group data by the Loc column automatically. Let’s make sure of that by going to the Group By tab.
Now we should cut the selection and keep only data of the 2008 year in the result.
To do this, let’s go to the Where tab and click the button with the green plus on it. The “=” symbol should appear. Let’s click the first phrase – <enter a value>.

After this the Operand Editor form should appear. Let’s select the Date and Time group from the Function list and double click the year(date) function in the list. After that let’s choose and double click the SalDate column in the other list.
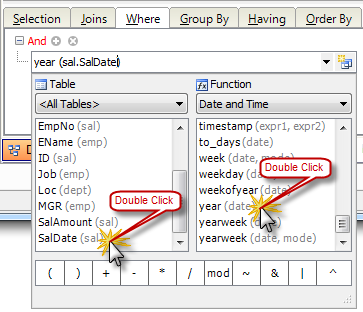
Let’s close the form and click the second one. Let’s enter 2008 there.

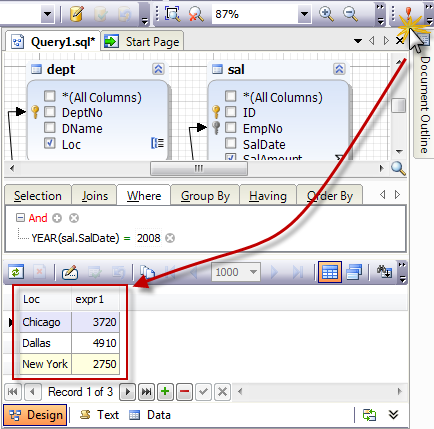
It’s time to execute the query we’ve created visually. To do this, let’s click F5.
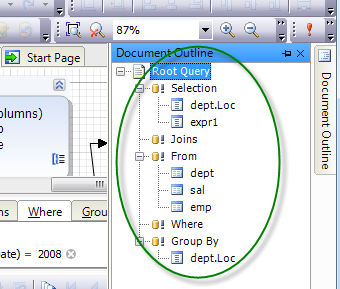
Now let’s look at the structure of the query we’ve created. To do this, let’s open Document Outline and open all nods.
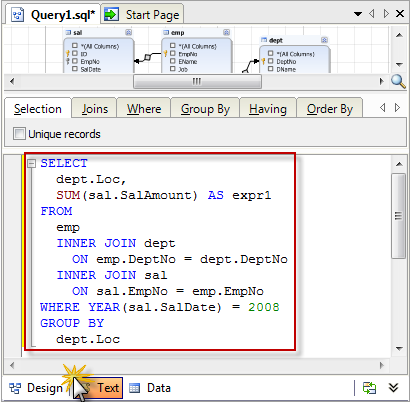
Now let’s look at the DML of the created query. To do this, let’s go to the Text tab.
Conclusion:
As we can see, the usage of a visual tool for building SQL queries allows to solve the task visually without going deep into the refinements of syntax of the SELECT statement itself and of the specifics connected with differences between MySQL and SQL Server syntax, to look at the syntax of the created query, to decrease the duration of the data selection process, and to look at the structure of the available query as a tree.
