Quite enough, there’s a need to change how data is displayed in a database so that the users could analyze it more easily. One of the cases of such transformation is transposing data from rows to columns in SQL Server.
Various analytical reports provide the ability to visualize data and speed up the process of making decisions based on the retrieved results.
Let’s look at these operations closer in an example of a database for a job recruitment service.
First of all, this is what the schema of the database looks like:
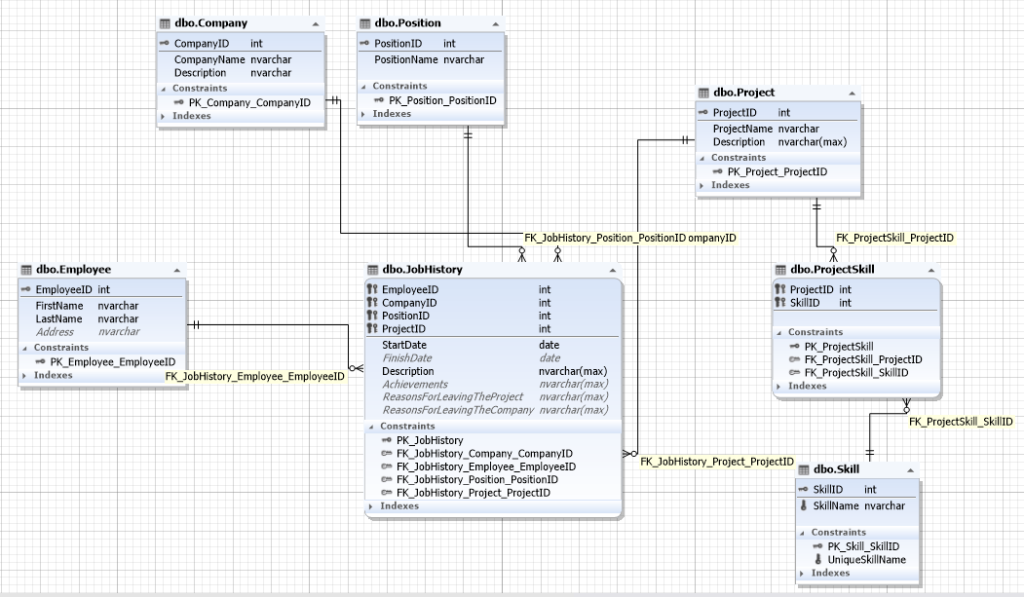
Fig.1 Database schema
Problem statement
We need to quickly understand who qualifies for a position that requires knowledge of C# and PostgreSQL.
First, let’s define the selection criteria.
For simplicity’s sake, let’s assume that we need to search for two skills – C# and PostgreSQL. We’ll omit the other ones to not overcomplicate our example.
We’re interested in the Employee, JobHistory, Project, and Skill entities, as well as the ProjectSkill cluster.
We also need to keep in mind that the potential employees should have used the required skills (C#, PostgreSQL) in the last 3 years, i.e., their experience is relevant.
It is also important to display the use of each skill (technology) for a particular year. As we’re taking data from the last 3 years, we need to show the use of skills for 2017, 2018, and 2019. The current year is 2020 (and I wrote this article in January, so the year has just only begun) and we will only analyze data from the previous 3 years to make things simpler.
It’s possible that no potential employees from the database have the relevant PostgreSQL experience. In this case, after confirming this with the employer, we can include the Oracle skill into our search (this database is the closest one to PostgreSQL).
Solution
Considering the starting conditions, we described earlier and the description of the desired output, we get the following query:
SELECT emp.[EmployeeID]
   ,emp.[LastName]
   ,emp.[FirstName]
   ,s.[SkillName]
   ,DATEDIFF(DAY, jh.[StartDate], jh.[FinishDate]) / (DATEDIFF(YEAR, jh.[StartDate], jh.[FinishDate]) + 1) AS [PeriodDay]
   ,CASE
WHEN ((2017 >= year(jh.[StartDate])) AND
(2018 > year(jh.[FinishDate]))) THEN 2017
WHEN ((2018 >= year(jh.[StartDate])) AND
(2019 > year(jh.[FinishDate]))) THEN 2018
WHEN ((2019 >= year(jh.[StartDate])) AND
(2020 > COALESCE(year(jh.[FinishDate]), year(GetDate())))) THEN 2019
END AS [Year]
FROM [Employee] AS emp
INNER JOIN [JobHistory] AS jh
ON emp.[EmployeeID] = jh.[EmployeeID]
INNER JOIN [Project] AS p
ON p.[ProjectID] = jh.[ProjectID]
INNER JOIN [ProjectSkill] AS ps
ON p.[ProjectID] = ps.[ProjectID]
INNER JOIN [Skill] AS s
ON s.[SkillID] = ps.[SkillID]
WHERE (jh.[FinishDate] >= DATEADD(YEAR, -3, GetDate())
OR (jh.[FinishDate] IS NULL));
Here’s a possible result of this query:
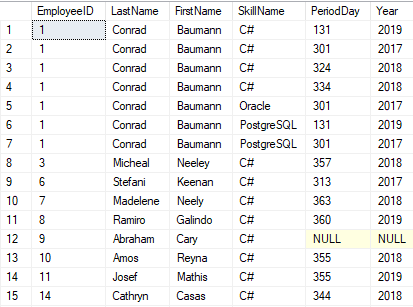
Fig.2 Pivot Table Example
This query provides the following information:
- EmployeeID – applicant’s ID
- LastName – applicant’s second name
- FirstName – applicant’s first name
- SkillName – skill (technology)
- PeriodDay – a distribution of the days in which the required skills were used for each year. It’s calculated in the [Year] column, omitting the non-working days (non-working days are included in the working periods)
- Year – the year to which a PeriodDay is related.
We have received the necessary data.
However, it’s not very simple to analyze data presented in this way.
Transposing data with PIVOT operator
For a more convenient visualization, let’s apply data transposition with the help of the PIVOT operator, and output the distribution of used skills for each year in separate columns:
SELECT
[EmployeeID]
   ,[LastName]
   ,[FirstName]
   ,[SkillName]
   ,[2017]
   ,[2018]
   ,[2019]
FROM (SELECT
emp.[EmployeeID]
  ,emp.[LastName]
  ,emp.[FirstName]
  ,s.[SkillName]
  ,DATEDIFF(DAY, jh.[StartDate], jh.[FinishDate]) / (DATEDIFF(YEAR, jh.[StartDate], jh.[FinishDate]) + 1) AS [PeriodDay]
  ,CASE
WHEN ((2017 >= year(jh.[StartDate])) AND
(2018 > year(jh.[FinishDate]))) THEN 2017
WHEN ((2018 >= year(jh.[StartDate])) AND
(2019 > year(jh.[FinishDate]))) THEN 2018
WHEN ((2019 >= year(jh.[StartDate])) AND
(2020 > COALESCE(year(jh.[FinishDate]), year(GetDate())))) THEN 2019
END AS [Year]
FROM [Employee] AS emp
INNER JOIN [JobHistory] AS jh
ON emp.[EmployeeID] = jh.[EmployeeID]
INNER JOIN [Project] AS p
ON p.[ProjectID] = jh.[ProjectID]
INNER JOIN [ProjectSkill] AS ps
ON p.[ProjectID] = ps.[ProjectID]
INNER JOIN [Skill] AS s
ON s.[SkillID] = ps.[SkillID]
WHERE (jh.[FinishDate] >= DATEADD(YEAR, -3, GetDate())
OR (jh.[FinishDate] IS NULL))) AS SourceTable
PIVOT
(
AVG([PeriodDay])
FOR [Year] IN ([2017], [2018], [2019])
) AS PivotTable;
Here’s a possible result of this query:
Fig.3 Transposing data with PIVOT operator
In the first four columns, the same information is displayed as in the previous query, and the last three columns show the distribution of used skills for years 2017, 2018, and 2019 respectively.
You can create this visualization in tools like SSRS and dbForge Studio for SQL Server. These solutions also allow you to create various reports.
Transposing data in dbForge Studio for SQL Server
Let’s take a closer look at how we can pivot tables in dbForge Studio for SQL Server.
To do this, first, click Pivot Table on the main menu or Report Designer on the Database menu.

Fig.4 Navigating to the report feature
The first command allows you to pivot the data from the table, and the second one helps you create a user report.
First, let’s learn about the Pivot Table functionality.
Let’s click it and insert the first script in the bottom of the newly-opened window:
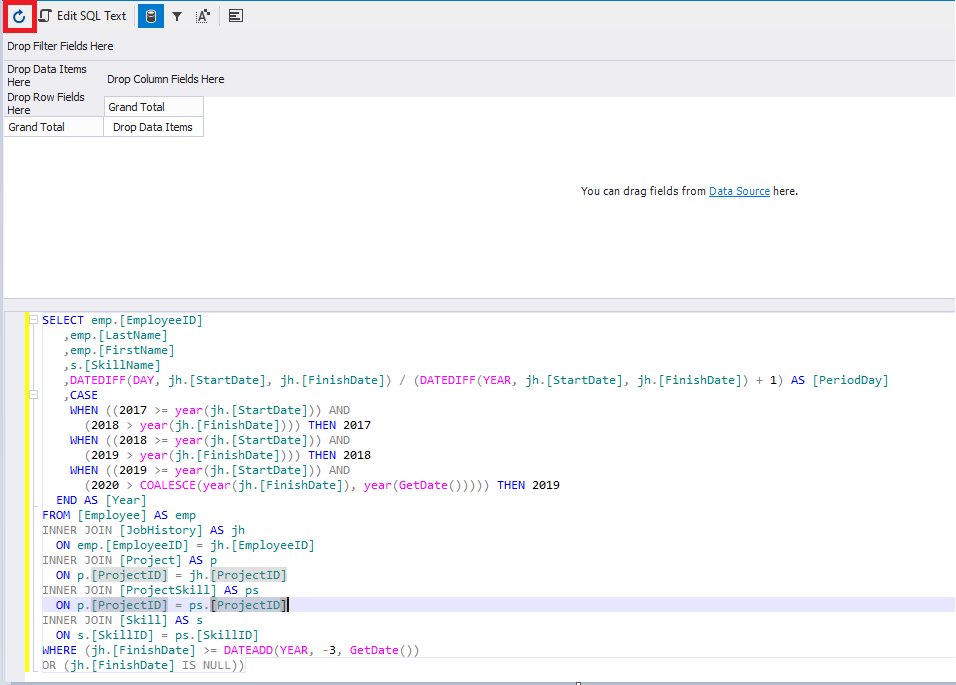
Fig.5 Refreshing the data with a user query
Now we need to click Refresh in the top left corner of the window. The result should be similar to the following:
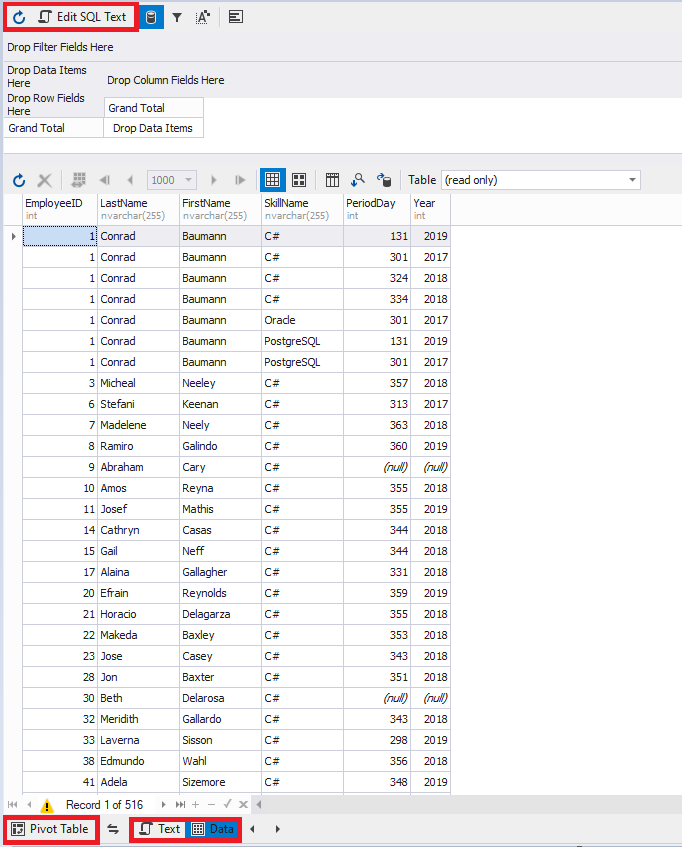
Fig.6 Pivot Table in dbForge Studio for SQL Server
We should remember what the buttons on the top left do – one refreshes the data according to a query, and Edit SQL Text allows you to change the query.
At the bottom, you can switch between data (Data button) and query text (Text button). With the help of Pivot Table, you can pivot the table. We’ll get back to it later.
You can also change data output using the following buttons:
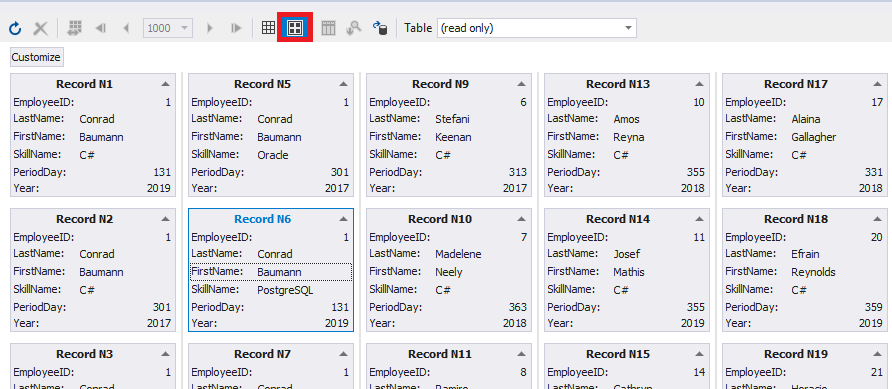
Fig.7 Controlling the presentation of retrieved data – 2
and
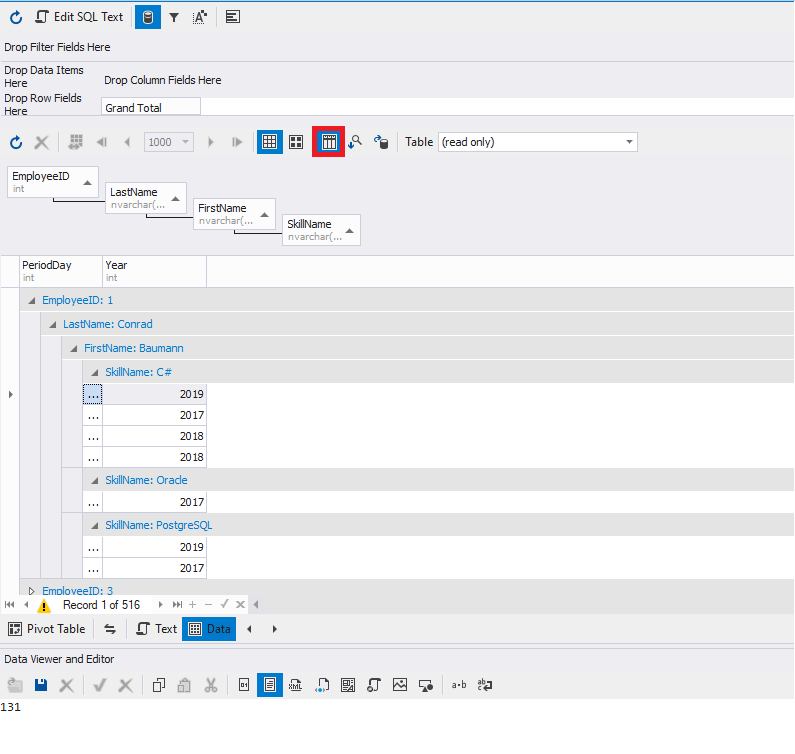
Fig.8 Controlling the presentation of retrieved data – 3
In the last example, we grouped the data by the first four columns.
You can also sort and group data using the shortcut menu:
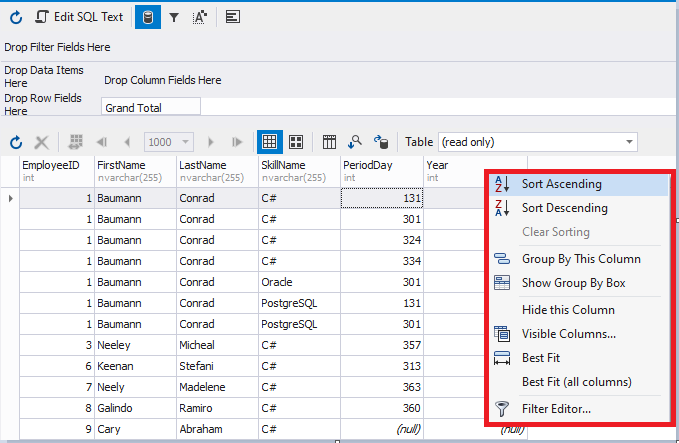
Fig.9 Context menu of the result data set window
As you can see, you can set filtering, visibility of certain data, and other parameters on the shortcut menu.
Now, let’s get back to pivoting our table. Click Pivot Table and select the necessary fields:
Fig.10 Configuring the data transposition
You need to select a column in the top right and the necessary command in the bottom right:
- Row Area – to a row
- Column Area – to a table
- Filter Area – to a filter
- Data Area – to data
And then click Add To.
In our example, the Row Area command was selected for the following attributes:
- EmployeeID
- LastName
- FirstName
- SkillName
The Column Area command was selected for the Year column.
The Data Area command was selected for the PeriodDay attribute.
Creating a user report in dbForge Studio for SQL Server
Let’s now briefly discuss creating user reports in dbForge Studio for SQL Server.
First, go to Database > Report Designer:
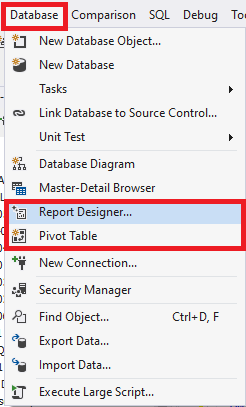
Fig.11 Navigating to the user report functionality
In the window that will be opened, select the desired report type (in this case, it’s Standard Report) and click Next:
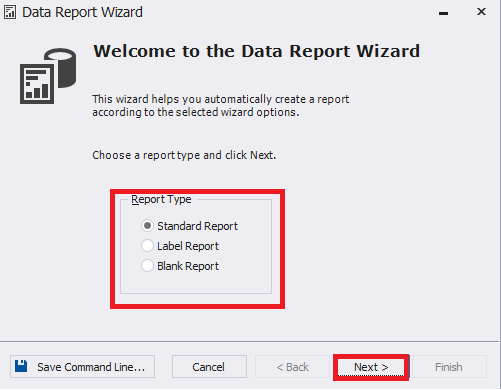
Fig.12 Selecting a report type
Now, select the connection and data type (in this case, Custom Query) and then click Next:
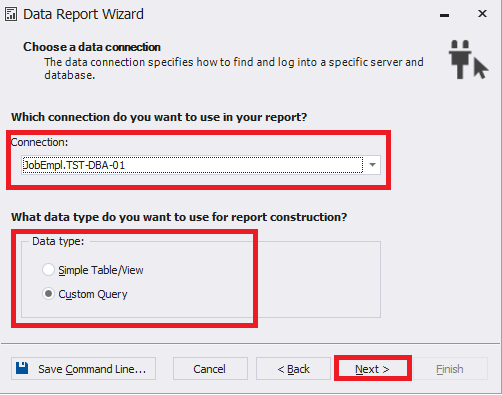
Fig.13 Configuring the report’s connection
Keep in mind that you can select the Simple Table/View data type instead of Custom Query if you need to build the report from one table or view. In this particular case, we need to select Custom Query as the report is built on the data from several tables.
You should also remember that the connection to a specific database should be established with SQL Server authentication, otherwise the query won’t work.
Let’s insert the necessary query and click Next:
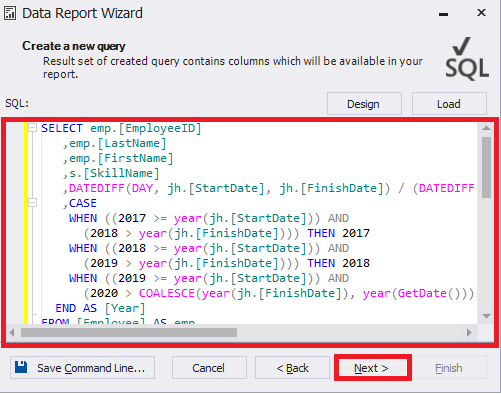
Fig.14 User query for the report
If you click Design before clicking Next, Query Builder will be opened. With its help, you can visually create the query you need.
The Load button allows you to load a previously saved query script.
Next, choose all the columns needed for the report and click Next:
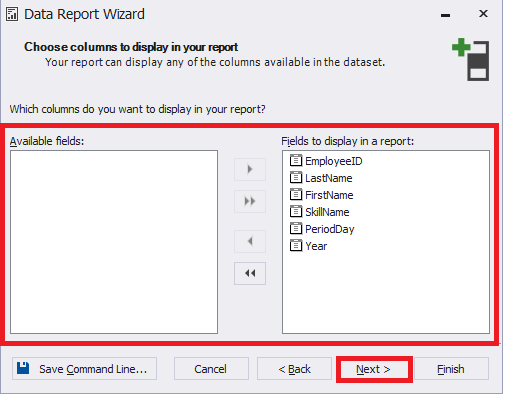
Fig.15 Selecting the fields on which you need to report
Then, configure the grouping and click Next:
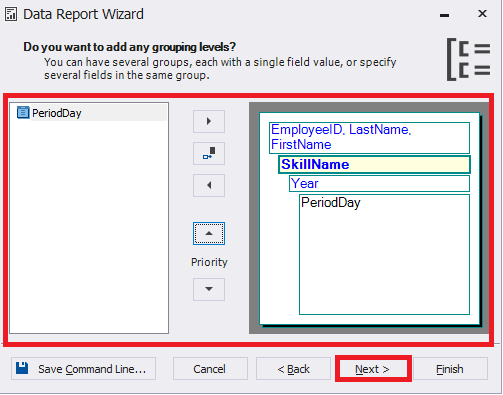
Fig.16 Configuring grouping for the report
Next, select the necessary aggregate functions and ignore the NULL-values as we don’t need them for data analysis:
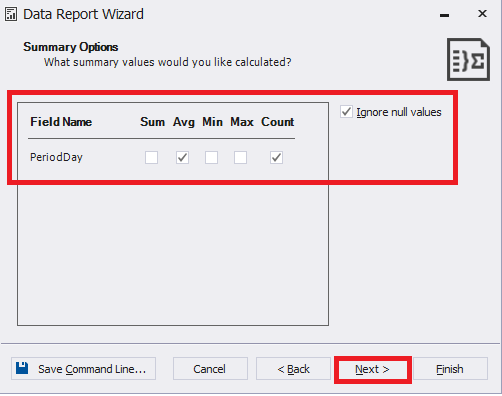
Fig.17. Setting data aggregation for the report
Here, we’ll leave default settings and only change the page orientation from portrait to landscape:
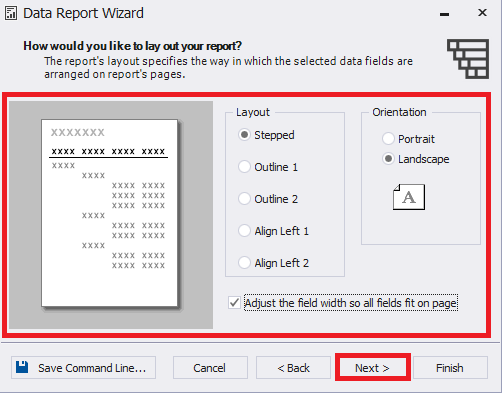
Fig.18 Configuring the report page
We’ll leave the Bold style and click Next:
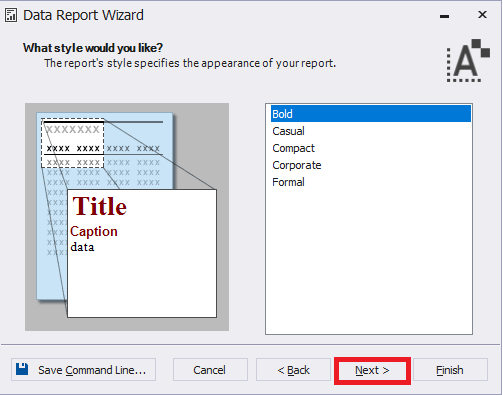
Fig.19 Configuring the report style
Finally, let’s name the report and click Finish:
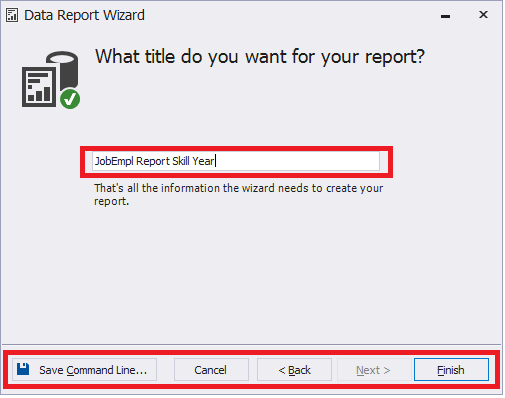
Fig.20 Specifying the report’s name
You can always return to any of the previous steps by clicking Back and save the report as a .bat file with the help of the Save Command Line option or even cancel the report creation by clicking Cancel.
Here’s the resulting report project:
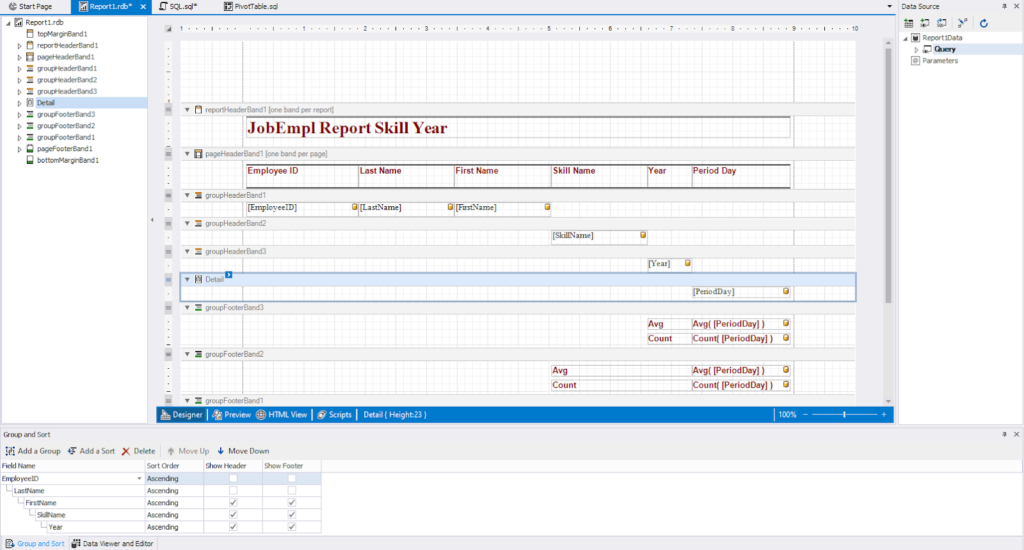
Fig.21 New user report
Report results can be saved in various frequently-used formats like RDP, HTML, RTF, and others.
The report projects are saved in the RDB format and you can edit them as easily with dbForge Studio for SQL Server as you can RDL files in the Report Builder or in Visual Studio.
You can learn more about creating reports in dbForge Studio for SQL Server here or here.
Additionally, if you want to know how to create data report from an SQL database using dbForge Studio for SQL Server, feel free to watch this video.
Conclusion
When there is a need to change how data is displayed in a database, we often need to transpose data from rows to columns, that is, to pivot tables. In this article, we provided a step-by-step guide on how to perform the PIVOT command in a T-SQL script and with dbForge Studio for SQL Server. The latter tool enables to set filtering as well as visibility of certain data and allows users to save reports in different widely-used formats including RDP, HTML, RTF, which makes it easier for users to edit.