Extended Events is a helpful and convenient solution designed to monitor your system performance. First introduced in SQL Server 2008, it has become the global default solution. SQL Server Extended Events apply to the DBMS state monitoring and help DB developers or DBAs to collect information, view it, and analyze it.
The value of this information is tangible. It allows you to detect any performance issues or bottlenecks. And if it does not help with the cause of the problem directly, it will, at least, guide you in the right direction. It can even let you get some information from the past, before the monitoring setup.
The solution is configurable and scales very well. It has a graphical interface helping users to configure the sessions and collect and analyze the data easier.
All the information is present in the system_health session – it is the default preconfigured session launched when you start the SQL server.
Among the data presented by the system_health session, note the following:
- Deadlocks
- Latch waits
- Lock waits
- Connectivity errors
- Security errors
- Errors with severity
However, if you examine some particular issues, it would be a good idea to configure additional sessions for SQL Extended Events. You define which occurrences interest you, and how the system should report them to you.
The SQL developer only needs a couple of minutes to configure this particular session. Hence, a little bit of work guarantees that you receive specific information on the spot whenever you want it.
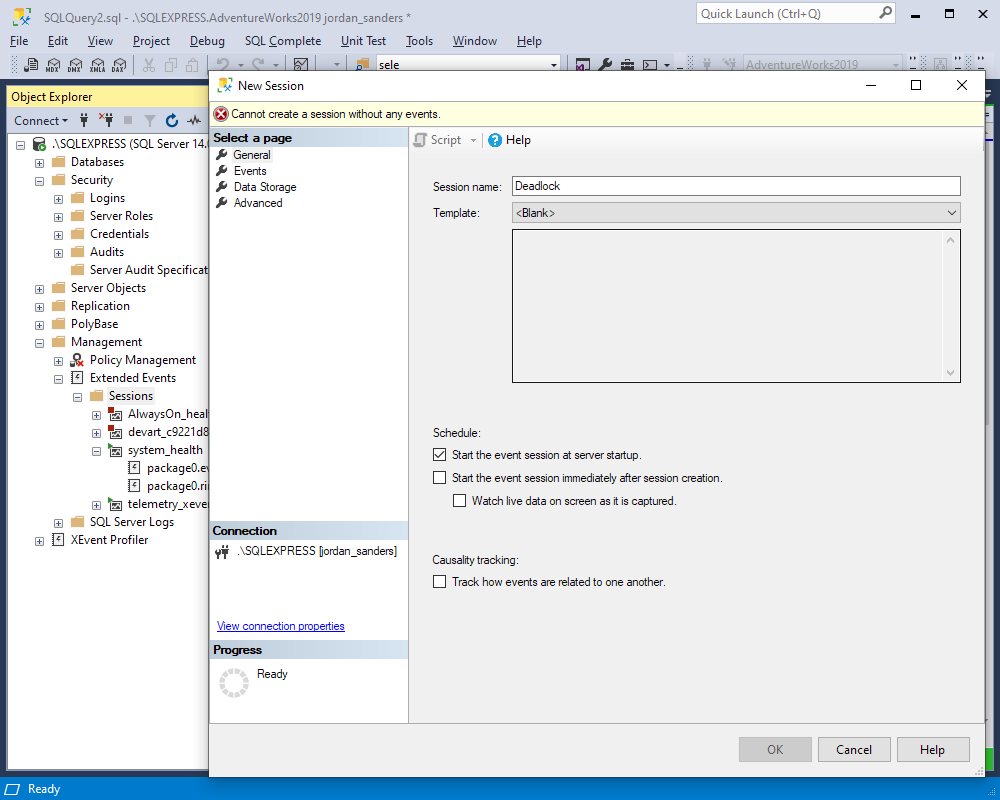
Let’s look at an example of configuring such a specific session to collect the deadlocks data.
In the Session Properties window, select the General section and check the “Start the event session at server startup” option under the Schedule section:
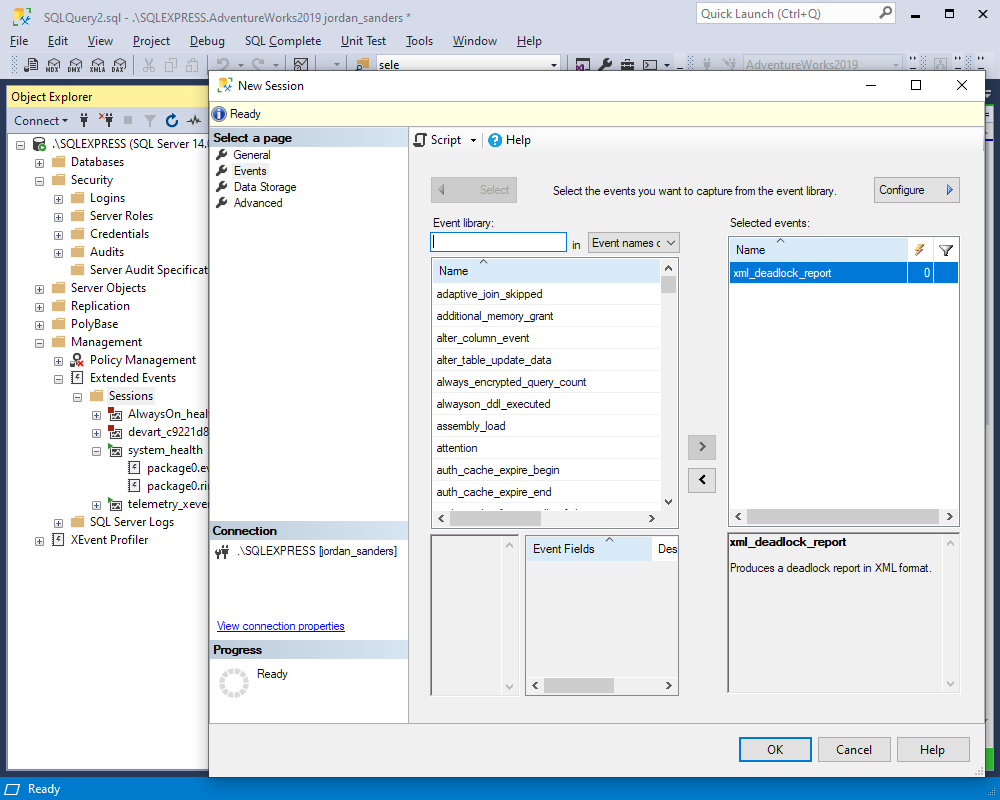
Proceed to the Event section. Here, you need to configure the events. As for the Data Storage and Advanced sections, you can set them optionally.
The code that you need to create the Deadlocks session will be similar to this:
CREATE EVENT SESSION [Deadlocks] ON SERVER
ADD EVENT sqlserver.xml_deadlock_report
ADD TARGET package0.event_file(SET filename=N’Deadlocks’)
WITH (MAX_MEMORY=4096 KB,EVENT_RETENTION_MODE=ALLOW_SINGLE_EVENT_LOSS,MAX_DISPATCH_LATENCY=30 SECONDS,MAX_EVENT_SIZE=0 KB,MEMORY_PARTITION_MODE=NONE,TRACK_CAUSALITY=OFF,STARTUP_STATE=ON)
GO
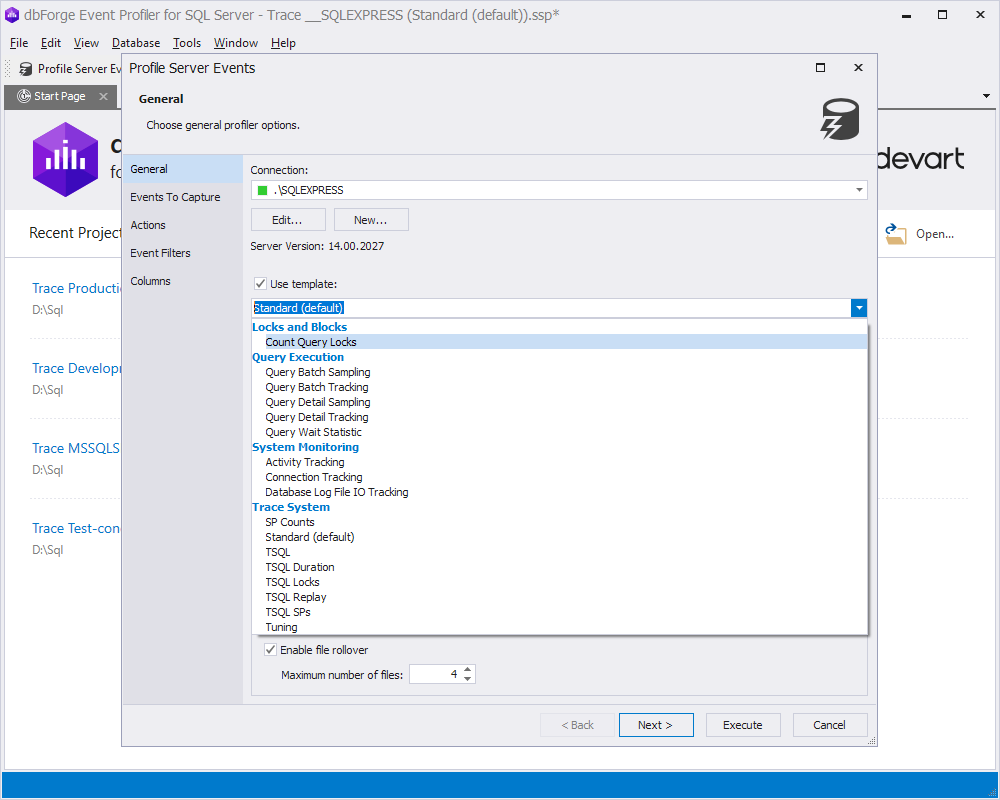
SQL Server Extended Events is not the only means of performing the SQL Server audit. There are such alternatives as Event Profiler, available in dbForge Studio for SQL Server, and based on the SQL Trace feature. It is a free solution that also records SQL Server events and allows you to analyze them. The information is saved in a separate file, and the analyst can use it whenever needed.
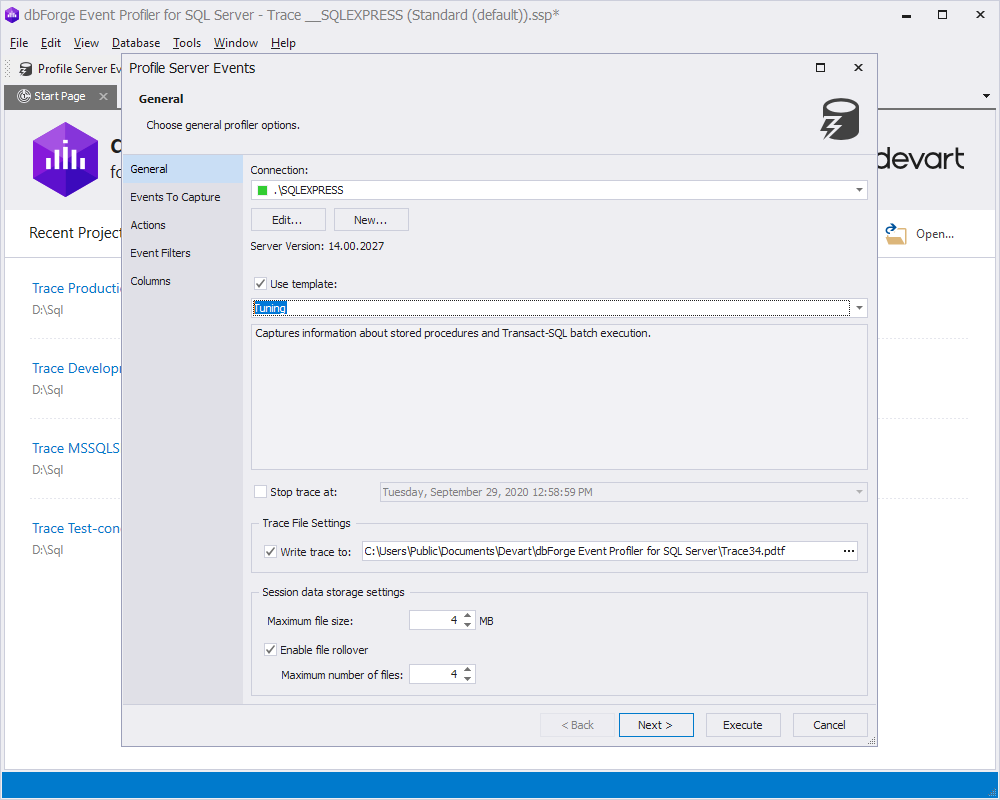
Moreover, the tool is swift – it requires a couple of seconds to launch and load the data. It does not overburden the server at all, and it lets you filter the results for your convenience. Below you can see an example of the Event Profiler configuration.
Select the tracing type:
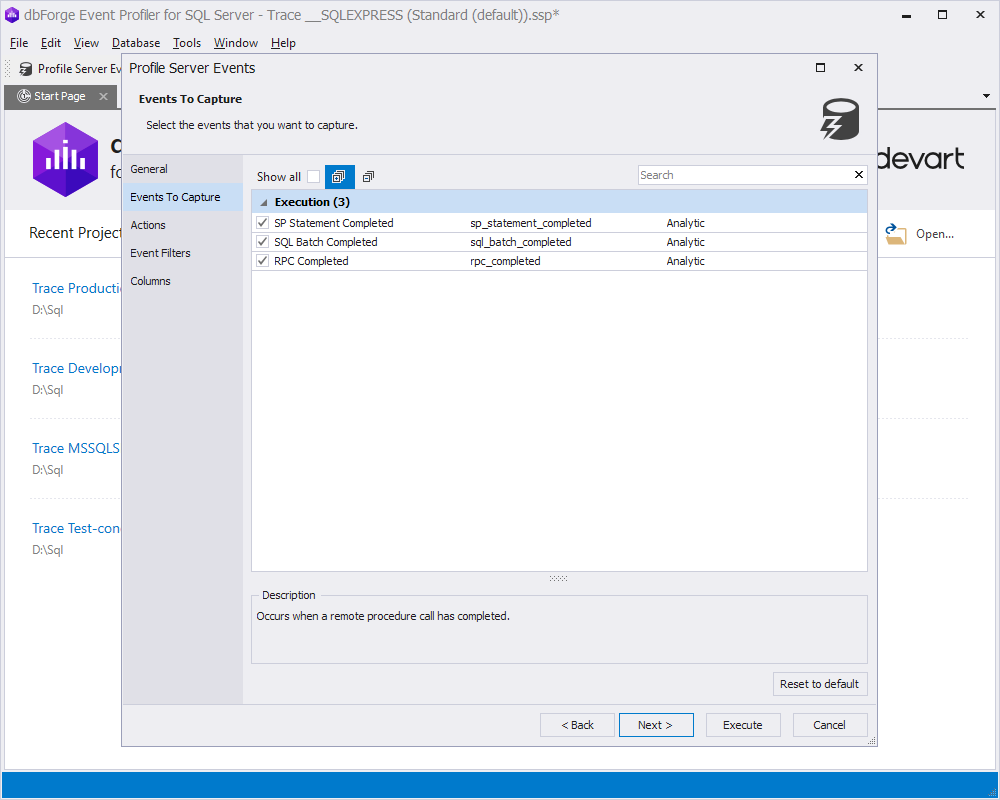
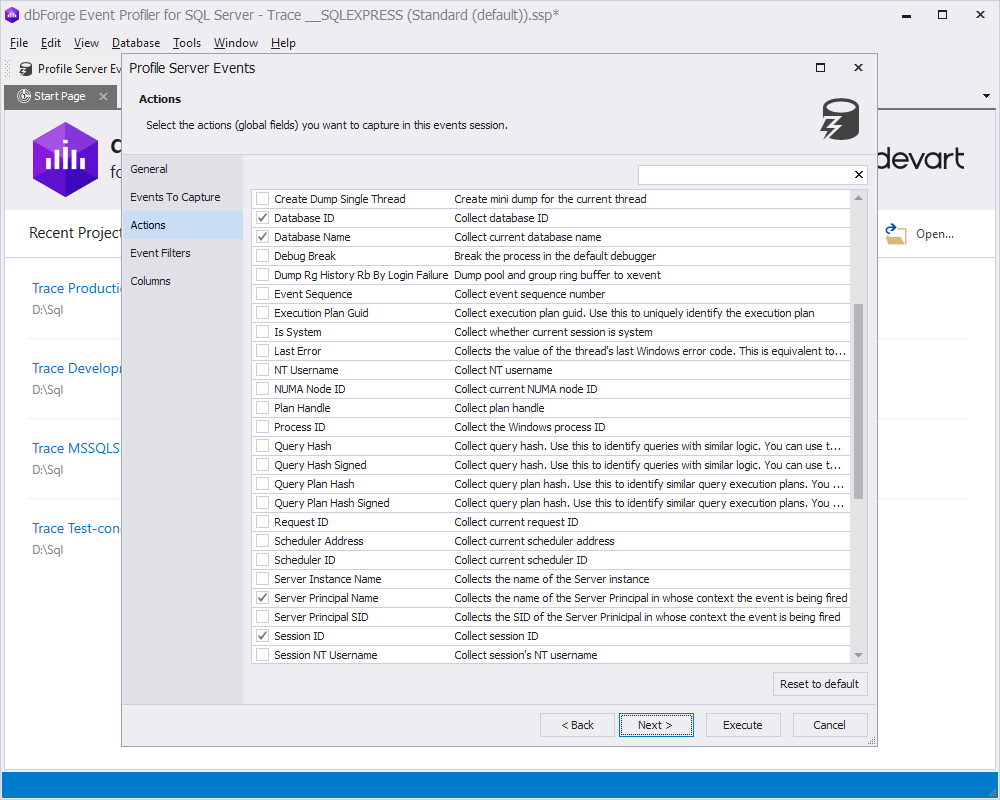
Choose the elements to capture and get the information for:
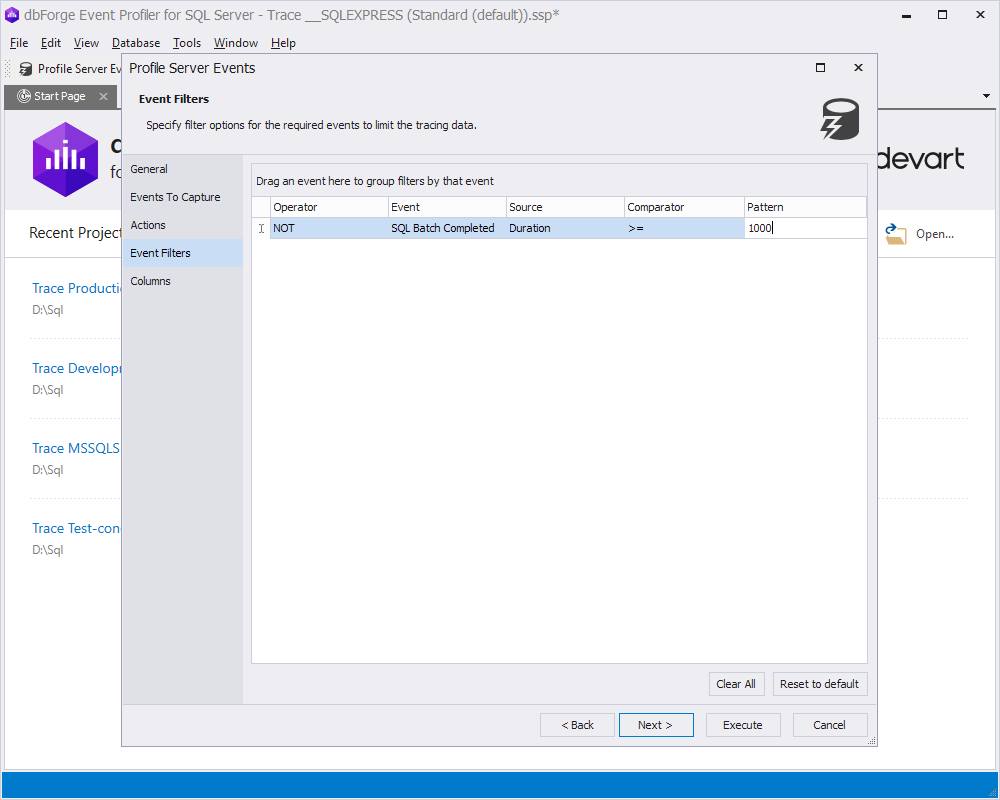
Filters are available for more targeted and convenient viewing. You can specify those filters according to your needs:
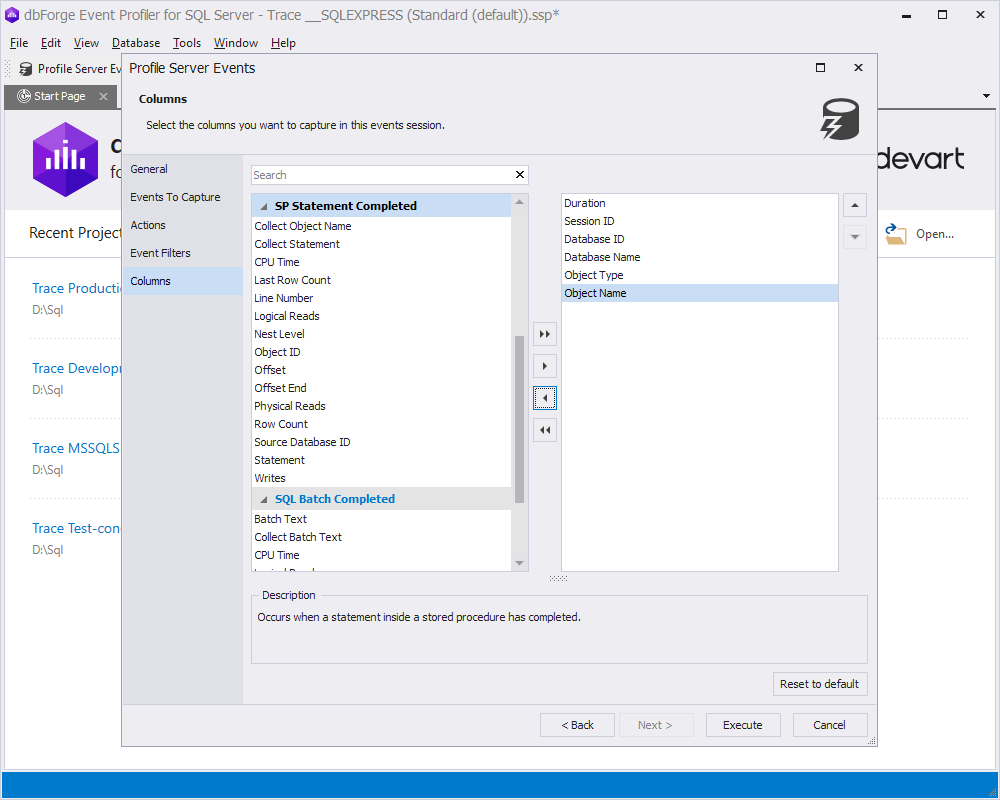
Configure which columns you want to display:
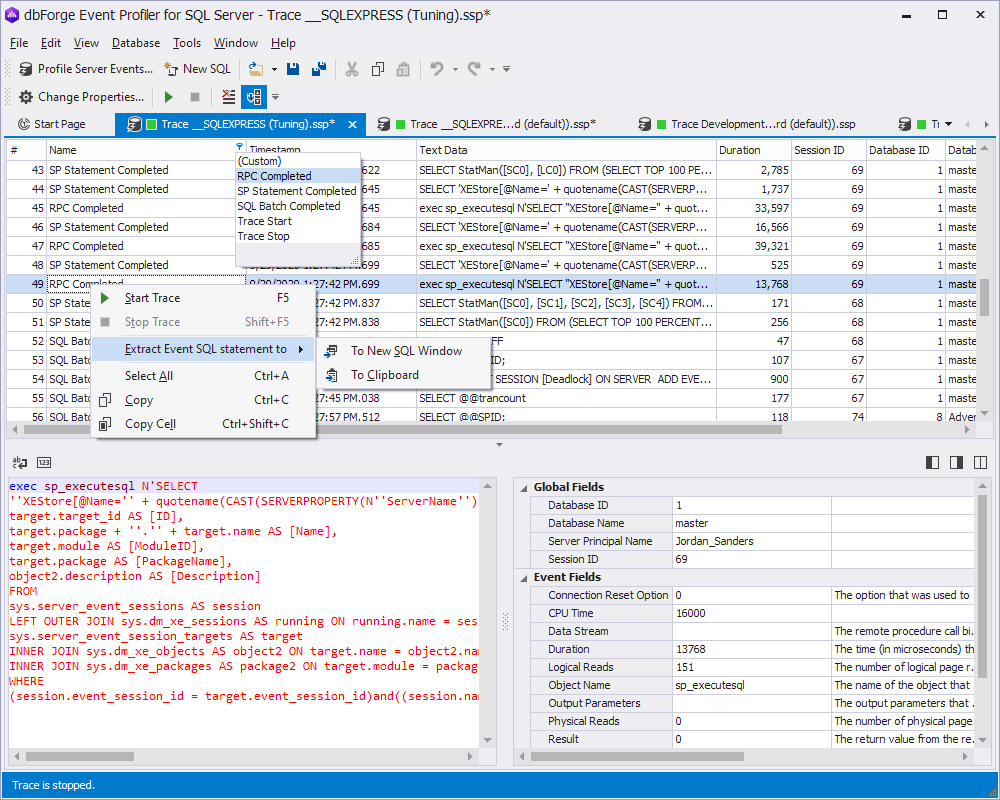
Have a look at an example of a compiled trace file:
Currently, SQL Server Extended Events is the smartest solution. More tools to manage them emerge with each new major version of the SQL Server, making configuration even more simple for you.