")
A typical relational database table contains multiple rows, quite often with duplicate values in some columns. Data in such a table is usually stored in random order. By running a query to select data from a database table, you can perform filtering, sorting, grouping, selection, and other operations with data.
Nevertheless, the results of that kind of query (data) will still be displayed downwards, which may complicate the analysis. Pivot tables (inverted tables) extend the data across, rather than downward. In this way, the query results are much easier to perceive, compare, analyze, and filter.

What is a pivot table?
A Pivot Table is an effective technique for calculating, compiling, and analyzing data bound to simplify the search for patterns and trends. Pivot Tables can help you aggregate, sort, organize, reorganize, group, sum or average data stored in a database to understand data relations and dependencies in the best possible way.
Let’s compare two ways of creating a pivot table in PostgreSQL: using the crosstab() function in PostgreSQL, which allows transposing rows to columns, and with the help of the dbForge Studio for PostgreSQL tool.
Below is a script for creating objects needed to build a pivot table.
CREATE TABLE IF NOT EXISTS products(
  product_id int PRIMARY KEY,
  product_name varchar(255) NOT NULL
  );

CREATE TABLE IF NOT EXISTS customers(
  customers_id int PRIMARY KEY,
  customers_name varchar(255) NOT NULL
  );

CREATE TABLE IF NOT EXISTS product_customers(
  product_customers int PRIMARY KEY,
  product_id int NOT NULL REFERENCES products(product_id),
  customers_id int NOT NULL REFERENCES customers(customers_id),
  cost decimal(18,2)
  );

CREATE OR REPLACE VIEW v_product_customers
AS
SELECT
  p.product_name,
  c.customers_name,
  pc.cost
FROM products p
  INNER JOIN product_customers pc
    ON p.product_id = pc.product_id
  INNER JOIN customers c
    ON pc.customers_id = c.customers_id;

DROP VIEW IF EXISTS v_product_customers;
CREATE VIEW v_product_customers
AS
  SELECT
    c.customers_name,
    p.product_name,
    pc.cost
  FROM customers c
    INNER JOIN product_customers pc
      ON c.customers_id = pc.customers_id
    INNER JOIN products p
      ON pc.product_id = p.product_id;

--
-- Inserting data into table customers
--
INSERT INTO customers(customers_id, customers_name) VALUES
(1, 'Yadira Villanueva'),
(2, 'Britta Ayres'),
(3, 'Bernard Creighton'),
(4, 'Merle Reiter'),
(5, 'Wilfredo Southern'),
(6, 'April Fife'),
(7, 'Vivienne Goodson'),
(8, 'Dorian Conaway'),
(9, 'Leonila Malone'),
(10, 'Ali Darling'),
(11, 'Francis Shannon'),
(12, 'Moises Adame'),
(13, 'Aubrey Boyce'),
(14, 'Erasmo Abel'),
(15, 'Tamika Wampler'),
(16, 'Geoffrey Hammonds'),
(17, 'Garth Vasquez'),
(18, 'Loree Wooden'),
(19, 'Sherly Prewitt'),
(20, 'Ward King');

--
-- Inserting data into table products
--
INSERT INTO products(product_id, product_name) VALUES
(1, 'Tweetholdar'),
(2, 'Promuton'),
(3, 'Transniollor'),
(4, 'Cleanputon'),
(5, 'Tabwoofphone'),
(6, 'Supceivra'),
(7, 'Supputommar'),
(8, 'Mictellar'),
(9, 'Armlififiator'),
(10, 'Monoculimry');

--
-- Inserting data into table product_customers
--
INSERT INTO product_customers(product_customers, product_id, customers_id, cost) VALUES
(832507484, 7, 12, 599.86),
(334131854, 9, 14, 666.71),
(1382965572, 6, 9, 894.33),
(1597713938, 9, 8, 848.85),
(2147483647, 6, 6, 508.04),
(1382965573, 2, 10, 638.58),
(617759119, 6, 13, 146.08),
(119383489, 10, 15, 231.77),
(1597713939, 5, 12, 998.12),
(832507485, 5, 17, 871.91),
(1010667740, 8, 2, 584.01),
(1225416106, 5, 16, 132.37),
(334131855, 1, 11, 332.42),
(617759120, 3, 19, 985.13),
(119383490, 4, 17, 438.44),
(1382965574, 4, 16, 688.49),
(1010667741, 6, 20, 888.06),
(334131856, 2, 4, 251.12),
(1964703150, 9, 4, 192.81),
(119383491, 9, 2, 681.65),
(334131857, 4, 4, 359.05),
(119383492, 3, 13, 731.14),
(1225416107, 1, 16, 385.05),
(1010667742, 2, 6, 397.35),
(832507486, 2, 4, 455.02),
(1597713940, 5, 2, 144.45),
(1225416108, 2, 1, 99.66),
(617759121, 10, 9, 640.5),
(1382965575, 10, 19, 504.89),
(334131858, 10, 10, 270.2),
(1749954789, 8, 2, 370.35),
(1964703151, 7, 17, 940.91),
(1749954790, 4, 1, 749.38),
(832507487, 8, 11, 558.63),
(1010667743, 7, 13, 111.01),
(1225416109, 6, 11, 934.01),
(1597713941, 1, 3, 865.3),
(119383493, 10, 11, 357.16),
(617759122, 2, 10, 208.68),
(1964703152, 3, 17, 716.09),
(1010667744, 8, 20, 442.94),
(832507488, 10, 16, 951.76),
(617759123, 7, 13, 745.16),
(832507489, 10, 5, 415.05),
(1225416110, 1, 7, 703.27),
(1749954791, 10, 2, 744.43),
(1010667745, 6, 7, 108.73),
(1964703153, 10, 6, 575.47),
(1749954792, 2, 5, 135.86),
(1225416111, 2, 16, 611.66),
(1382965576, 5, 4, 804.67),
(617759124, 2, 5, 497.38),
(1597713942, 3, 1, 178.92),
(334131859, 1, 4, 642.2),
(832507490, 2, 18, 946.02),
(1964703154, 3, 20, 966.92),
(1749954793, 6, 5, 629.9),
(617759125, 8, 15, 118.94),
(832507491, 4, 9, 775.5),
(1964703155, 8, 19, 426.35);
Creating Pivot Tables using the crosstab() function
In PostgreSQL, pivot tables are created with the help of the crosstab() function, which is part of the optional tablefunc module. To start using this function, you need to install the tablefunc module for a required database. In PostgreSQL 9.1 and later versions, this module is installed by running a simple command:
CREATE EXTENSION IF NOT EXISTS tablefunc;
Having installed the module, you can use crosstab to get a pivoted result set:
SELECT * FROM crosstab(
$$SELECT customers_name, product_name, SUM(cost) AS cost
  FROM v_product_customers
   GROUP BY customers_name, product_name
   ORDER BY customers_name$$,
$$SELECT 'Tweetholdar' UNION ALL
  SELECT 'Promuton' UNION ALL
  SELECT 'Transniollor' UNION ALL
  SELECT 'Cleanputon' UNION ALL
  SELECT 'Tabwoofphone' UNION ALL
  SELECT 'Supceivra' UNION ALL
  SELECT 'Supputommar' UNION ALL
  SELECT 'Mictellar' UNION ALL
  SELECT 'Armlififiator' UNION ALL
  SELECT 'Monoculimry'$$
)
AS ct(customers_name VARCHAR, Tweetholdar NUMERIC,Promuton NUMERIC,Transniollor NUMERIC,Cleanputon NUMERIC,Tabwoofphone NUMERIC,Supceivra NUMERIC,Supputommar NUMERIC,Mictellar NUMERIC,Armlififiator NUMERIC,Monoculimry NUMERIC);
As an output, you will get the following pivot table:
It must be pointed out, that should you need to rearrange the pivot statistics or add intermediate calculations to the pivot table, the query text will have to be edited for each specific case.
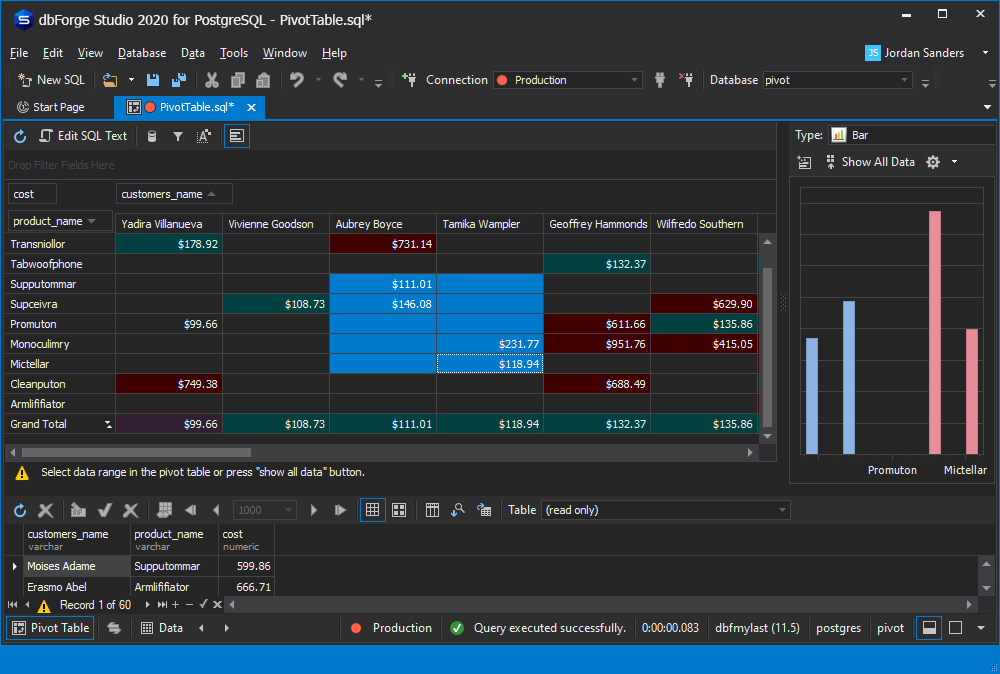
Creating pivot tables in dbForge Studio for PostgreSQL
dbForge Studio for PostgreSQL provides an extremely simple and convenient mechanism for creating pivot tables.
First, let’s create a Pivot Table document. There are three ways to do this:
- From the main menu (File -> New -> Pivot Table)
- From the context menu on the table (view) in the Database Explorer window (Send To -> Pivot Table);
- From the Start Page window (Data Analysis -> Build -> Pivot Table).

Then you need to drag the table (view) onto the Data Source area of the Pivot Table document. Alternatively, you can click Edit SQL Text on the toolbar and execute the query.
After the input data has been loaded into the Pivot Table window and the table column names have been displayed, you can immediately proceed to create the pivot table:
- Drag the column you make the pivot table for to the Drop Row Fields Here area.
- Drag the column with categories, in our case it’s the Name column, to the Drop Column Fields Here area.
- Drag the column with data, in our case it’s the Counts column, to the Drop Data Items Here area.

As a result, we get a pivot table very similar to the table created with the help of the crosstab() function. Note, that dbForge Studio for PostgreSQL automatically generates the Grand Total columns. By default, the Grand Total cells contain the sum of the values of the rows (columns). Instead of the sum of all values, you can configure to display:
- average of values
- maximum value
- minimum value
- count of values
- standard deviation (both counted over a subset or entire data)
- population variance (both counted over a subset or entire data).

The Pivot Table document window has an extremely user-friendly graphical interface. For example, to apply sorting or filtering to any column in a pivot table, you will only need a couple of clicks.
Without much effort, you can also change the background of the pivot table cell, the font color, or visualize pivot data as a chart.
Conclusion
The Pivot Table functionality built into dbForge Studio provides interactive data visualization that is vastly superior to the crosstab() capabilities in PostgreSQL. To look at the data from a completely different angle, the user needs just a few clicks. In addition, unlike the standard PostgreSQL pivot table creation tools, dbForge Studio provides a simple and exceedingly user-friendly graphical interface that makes creating, editing, and manipulating pivot tables much quicker and easier. The dbForge Pivot Table functionality comprises a flexible and practical tool for summarizing large data sets, that allows, among other things, creating charts for both all data and a selected data range.
Want to interactively explore your PostgreSQL data in different ways? Try the dbForge Studio for PostgreSQL tool by downloading it from the Devart website and see for yourself that extracting significance from a large, detailed data set has never been easier. Also, you can watch this video tutorial: