
This tutorial is to build the Sales Analytics dashboard by leveraging Power BI Desktop, Devart ODBC for Oracle driver and Oracle Database. It will not be used as the instruction on how to work on PowerBI Desktop or Oracle Database Engine instead we will demonstrate how we will work with Devart ODBC for Oracle driver.
Technology Background
Power BI Desktop
Microsoft Power BI Desktop is built for the analyst. It combines state-of-the-art interactive visualizations, with industry-leading data query and modelling built-in. Create and publish your reports to Power BI. Power BI Desktop helps empower others with timely critical insights, anytime, anywhere.
Oracle Database
Oracle database services and products offer customers cost-optimized and high-performance versions of Oracle Database, the world’s leading converged, multi-model database management system, and in-memory, NoSQL and MySQL databases.
Devart ODBC for Oracle Driver
ODBC Driver for Oracle is a high-performance connectivity solution with enterprise-level features for accessing Oracle databases from ODBC-compliant reporting, analytics, BI, and ETL tools on both 32-bit and 64-bit Windows, macOS, and Linux. Our ODBC driver fully supports standard ODBC API functions and data types and enables easy and secure access to live Oracle data from anywhere.
Prerequisites
Before starting to connect the Oracle database by using Devart ODBD for Oracle and building Prediction Sales Analytics, make sure to download all the necessary tools and drivers:
- Click here to download Power BI Desktop
- Click here to download Devart ODBC for Oracle Driver
- Click here to download the Sales data
Make sure to install the Oracle Database application as well.
Once all tools are installed, it’s critical to understand how to connect Power BI to Oracle database before moving forward. This involves configuring the Devart ODBC driver, setting up a DSN, and establishing the connection in Power BI Desktop. If that connection isn’t already in place, complete it first.
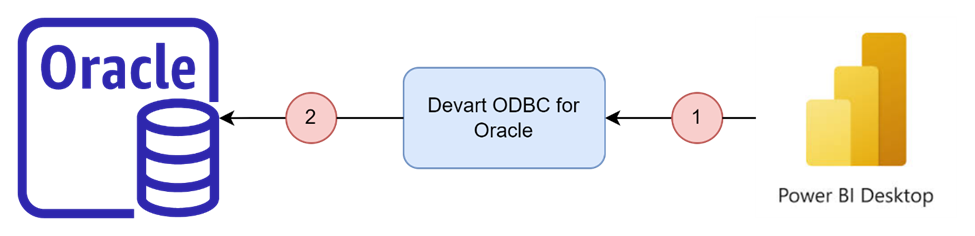
Architecture
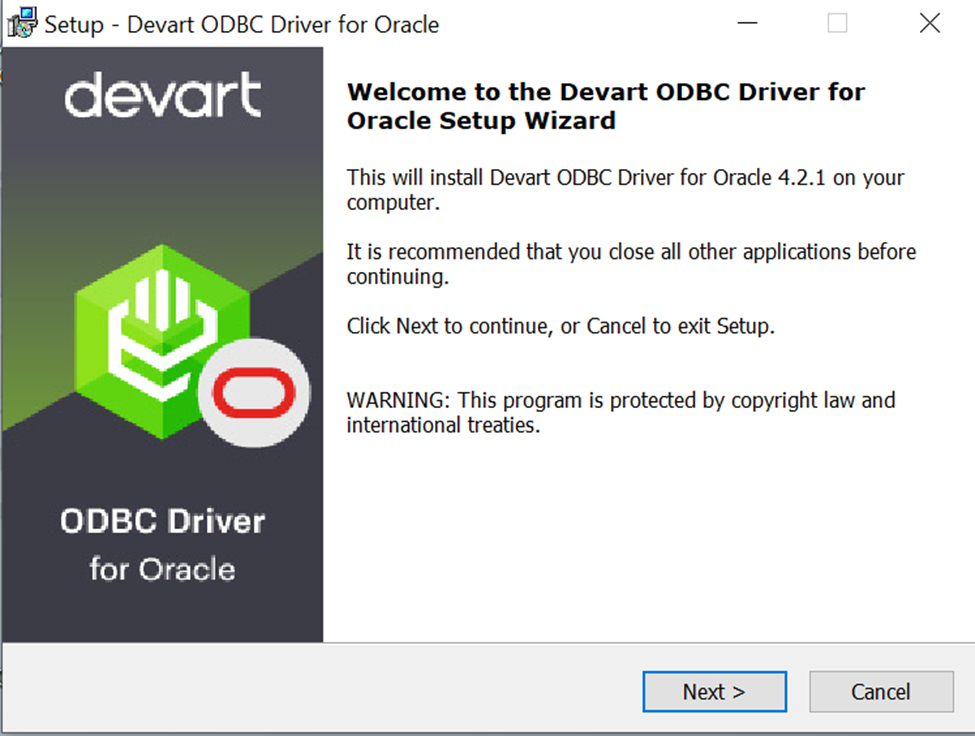
Install Devart ODBC for Oracle
Download and run the installer file to install
Follow the instructions
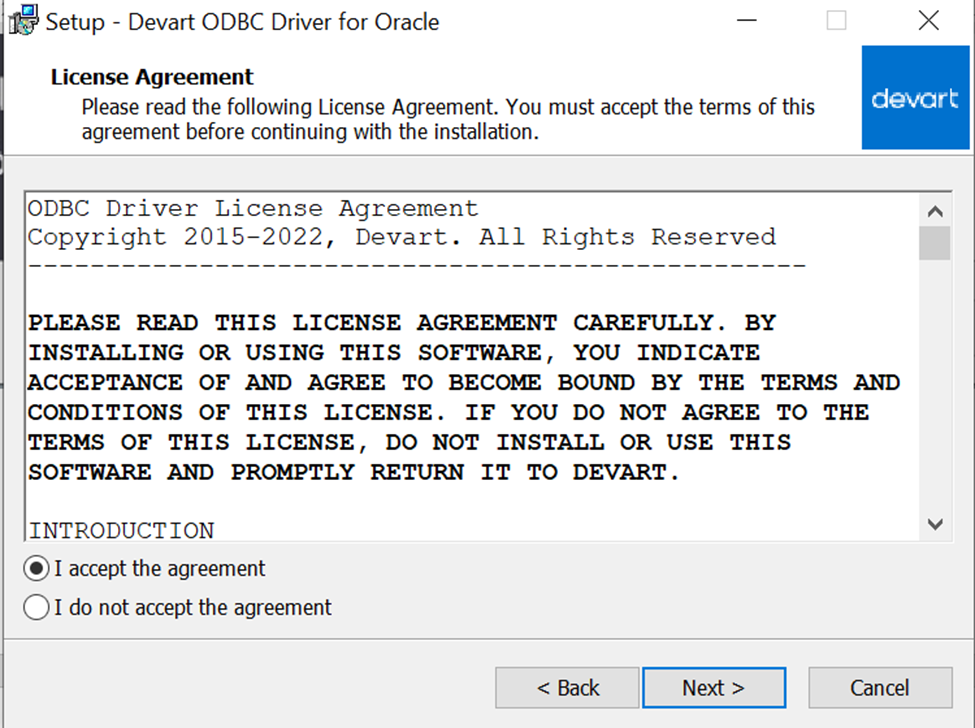
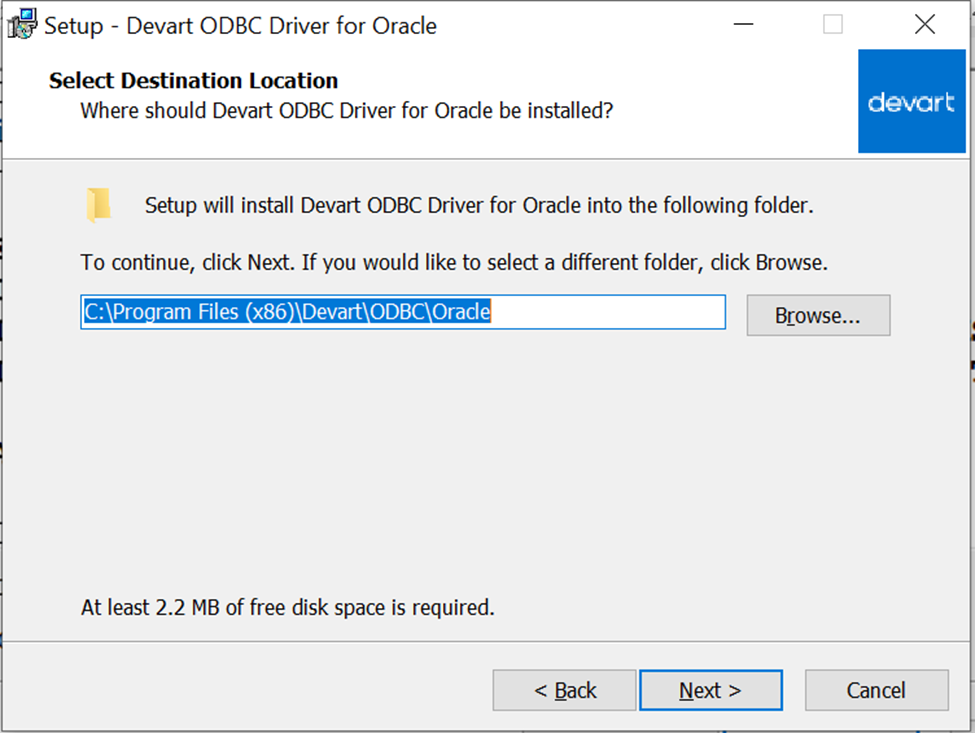
Select Destination Location
Select Components -> Full Installation
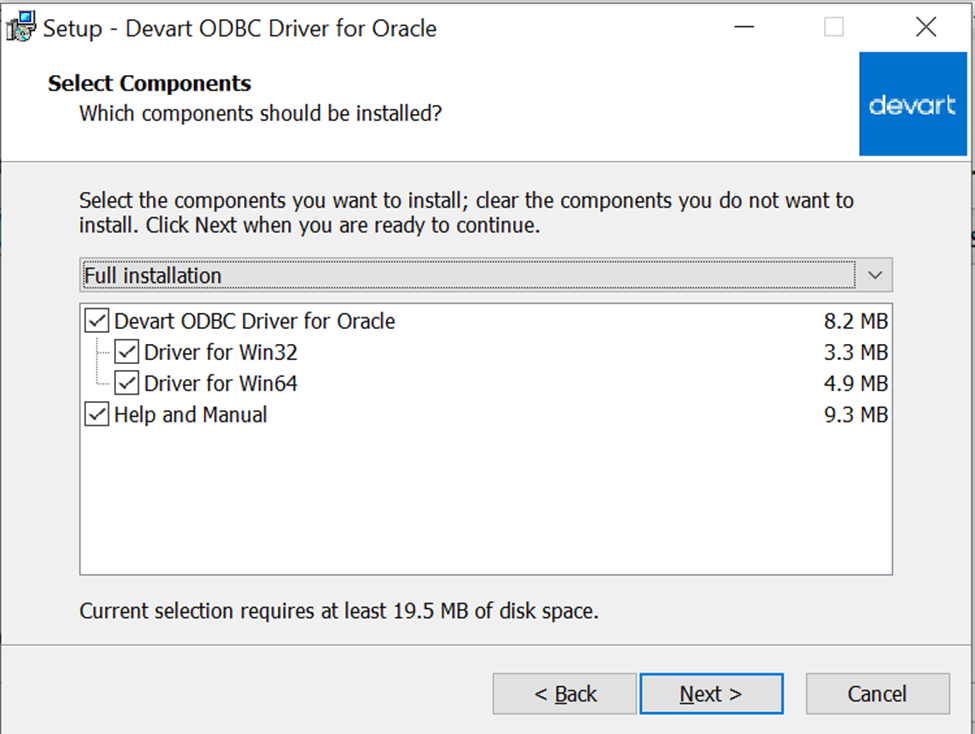
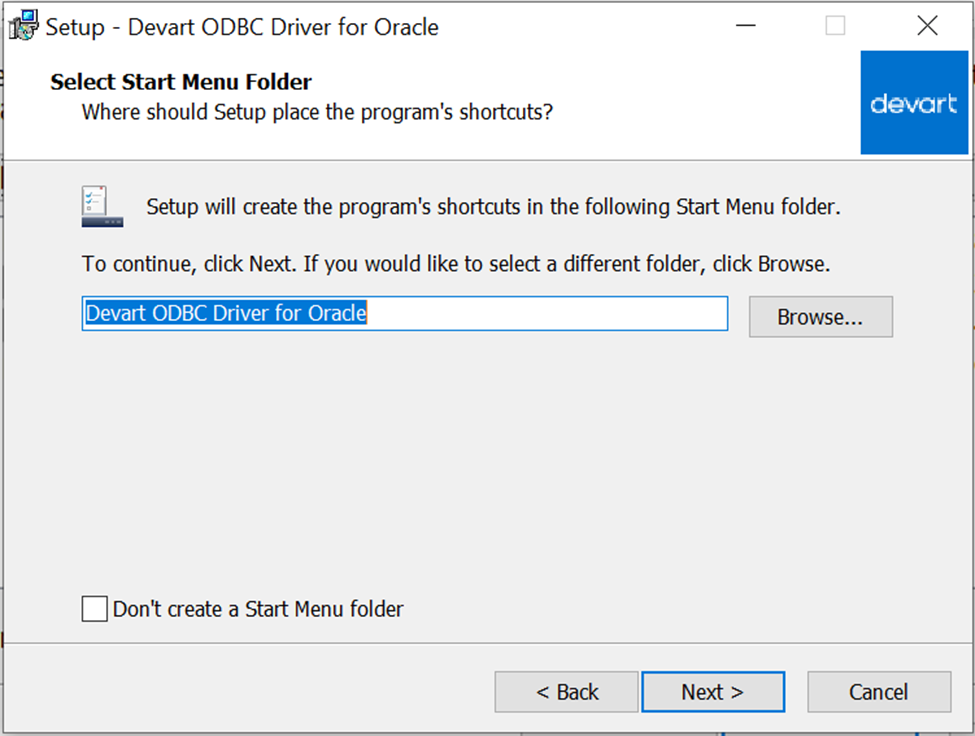
Click Next
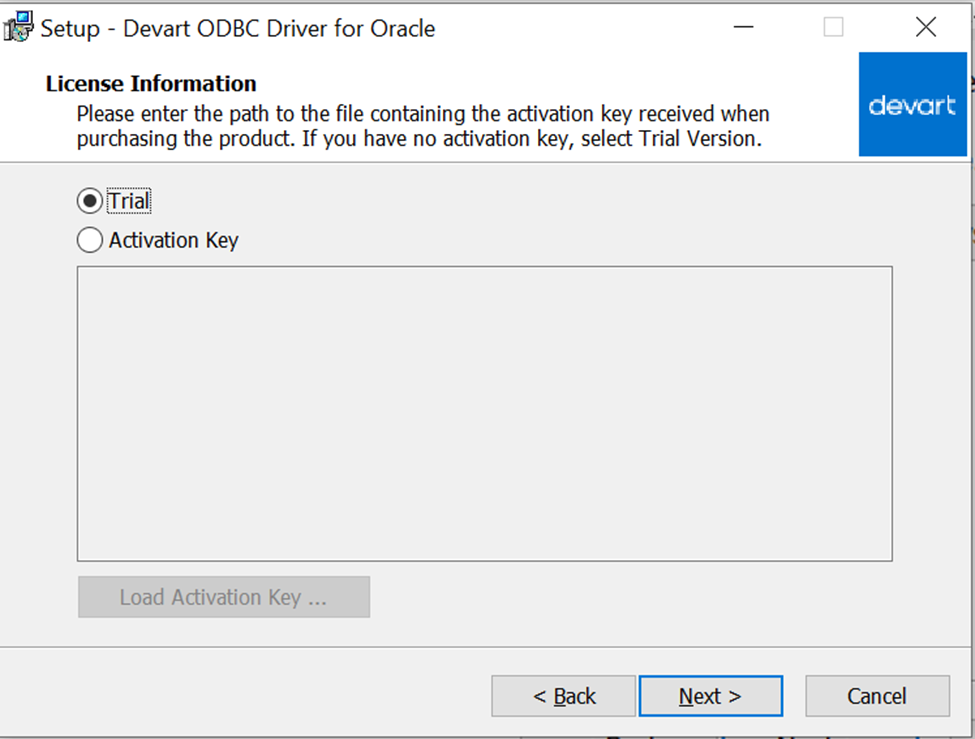
Click Next and enter the Activation Key or choose Trial option -> Next
Click Next to start the installation
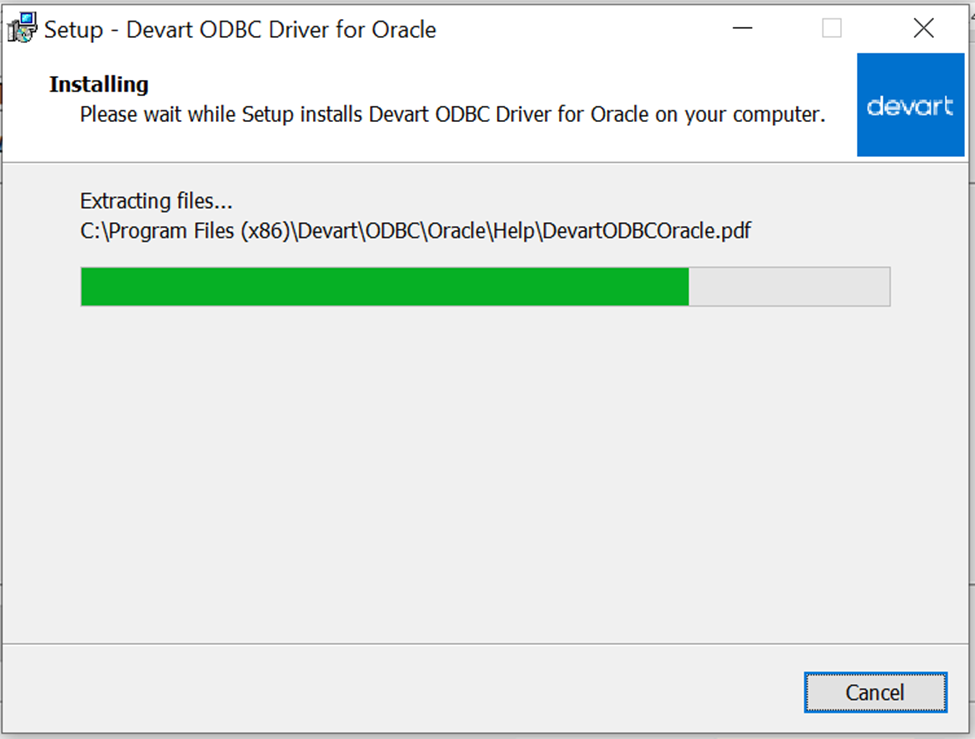
After the installation is completed, we continue configuring the driver
Driver Configuration
- Click Start, Run
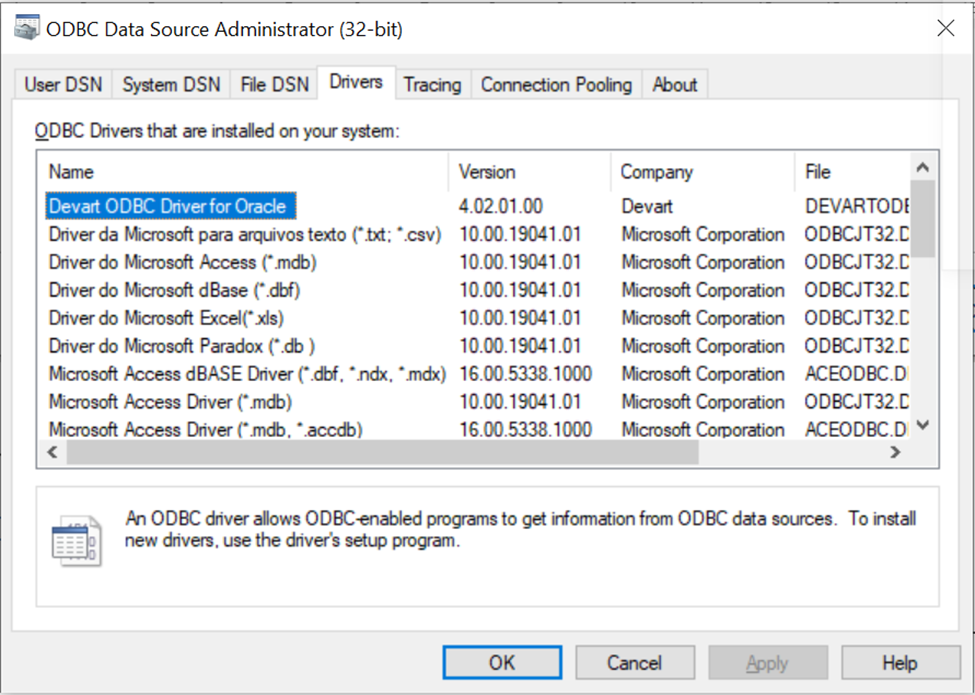
- Type the C:\WINDOWS\SysWOW64\odbcad32.exe if the system is 64bit to open ODBC Data Source Administrator
- Click on the Driver tab and make sure Devart ODBC Driver for Oracle is in the list.
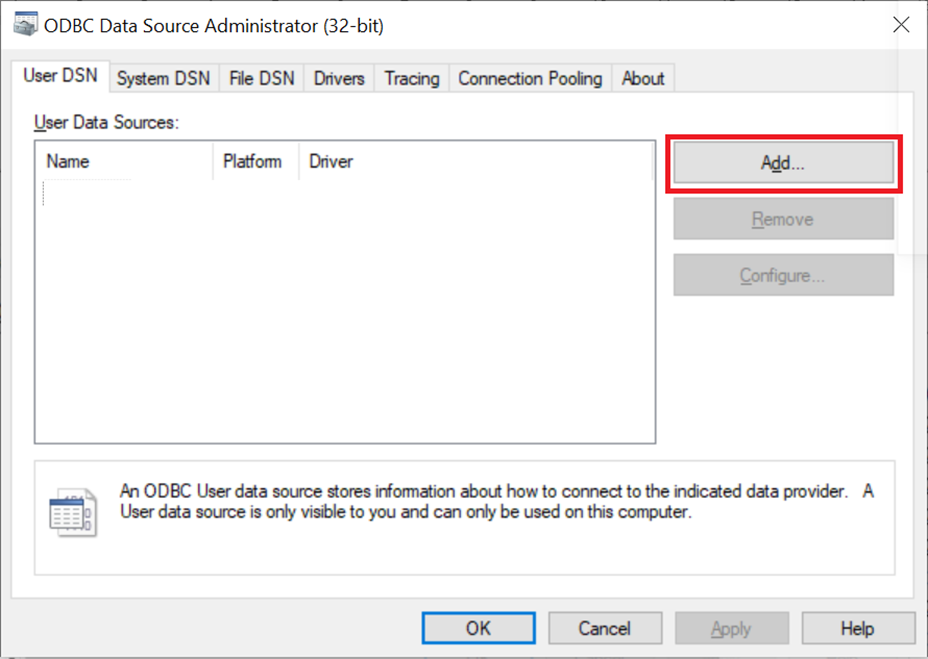
- Select the User DSN or System DSN tab.
- Click Add. The Create New Data Source dialogue will appear.
- Select Devart ODBC Driver for ODBC Driver for Oracle and click Finish. The driver setup dialogue will open.
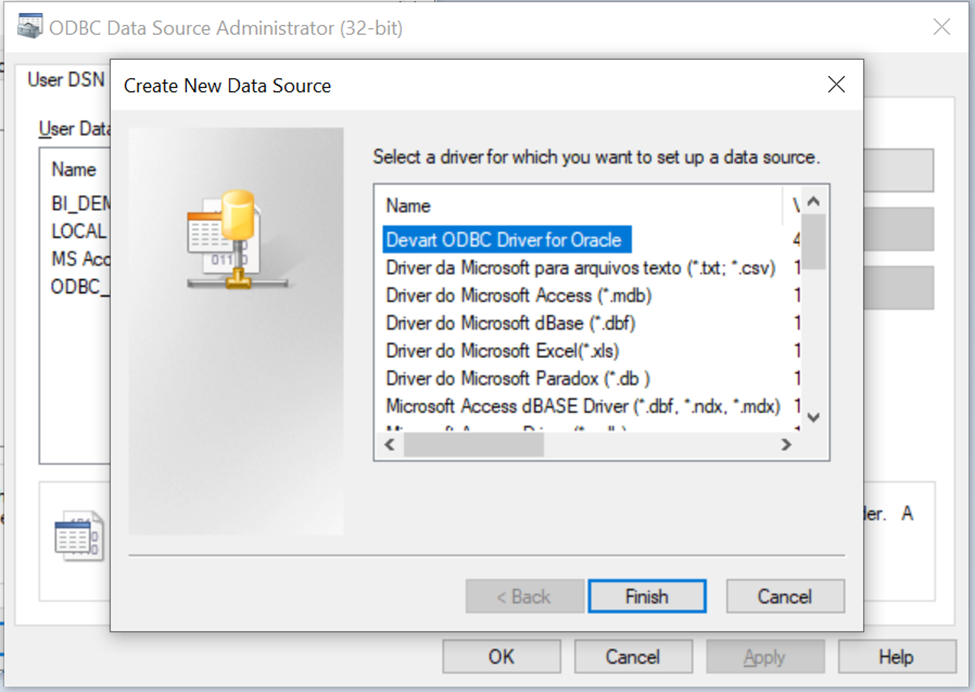
- Enter the connection information in the appropriate fields. Make sure the Oracle database is running up.
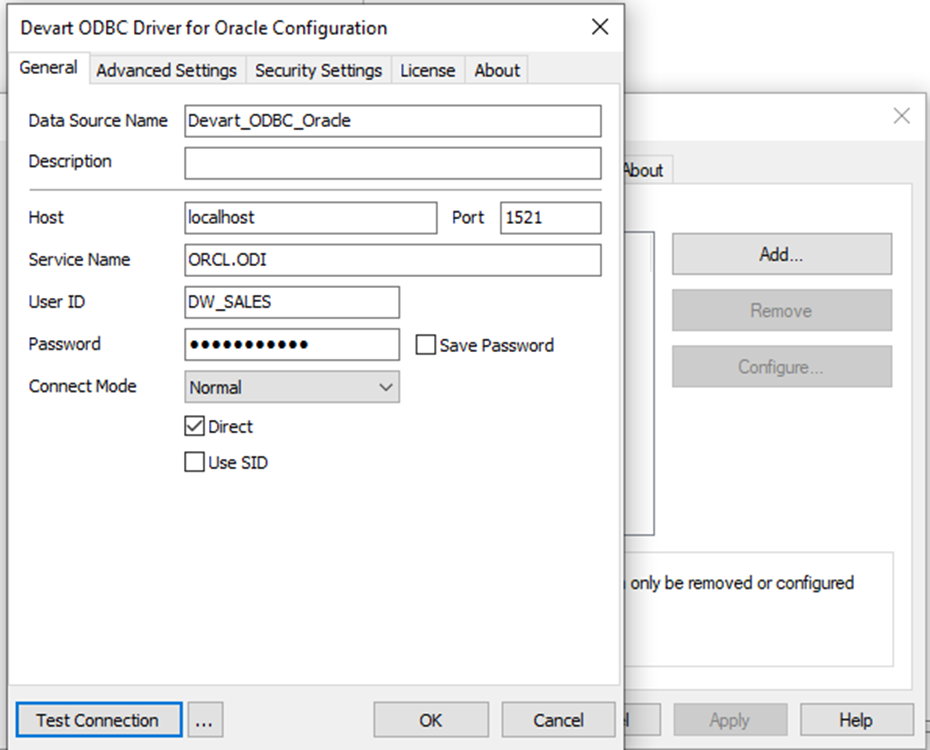
- Click on Test Connection and make sure the connection is correct.
Create Data
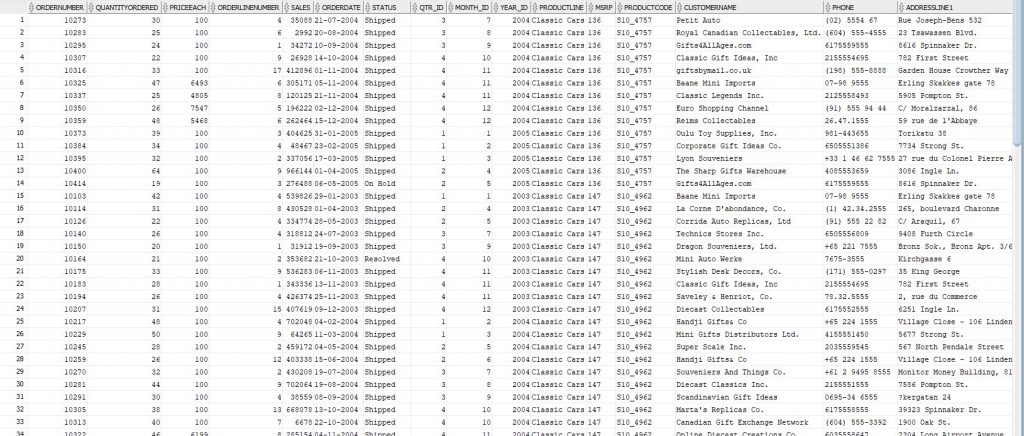
- Now, we will load Sales data into the DW_SALES user-schema.
- Create a new table DW_SALES_F
- Import data
Metadata Definition
| Column Name | Description | Data Type |
| ORDERNUMBER | Order Number ID | NUMBER(10,0) |
| QUANTITYORDERED | Quantity Ordered | NUMBER(10,0) |
| PRICEEACH | Price Each | NUMBER(10,2) |
| ORDERLINENUMBER | Order Number ID | NUMBER(10,0) |
| SALES | Sales | NUMBER(10,2) |
| ORDERDATE | Order Date | DATE |
| STATUS | Status | VARCHAR(50) |
| QTR_ID | Quarter ID of Order Date | NUMBER(2,0) |
| MONTH_ID | Month ID of Order Date | NUMBER(2,0) |
| YEAR_ID | Year of Order Date | NUMBER(4,0) |
| PRODUCTLINE | Product Line | VARCHAR(100) |
| MSRP | MSRP | VARCHAR(100) |
| PRODUCTCODE | Product Code | VARCHAR(100) |
| CUSTOMERNAME | Customer Name | VARCHAR(100) |
| PHONE | Phone | VARCHAR(100) |
| ADDRESSLINE1 | Address Line 1 | VARCHAR(100) |
| ADDRESSLINE2 | Address Line 2 | VARCHAR(100) |
| CITY | City | VARCHAR(100) |
| STATE | State | VARCHAR(100) |
| POSTALCODE | Postal Code | VARCHAR(100) |
| COUNTRY | Country | VARCHAR(100) |
| TERRITORY | Territory | VARCHAR(100) |
| CONTACTLASTNAME | Contact Last Name | VARCHAR(100) |
| CONTACTFIRSTNAME | Contact First Name | VARCHAR(100) |
| DEALSIZE | Deal Size | VARCHAR(100) |
CREATE TABLE DW_SALES_F(
    ORDERNUMBER       NUMBER(10, 0),
    QUANTITYORDERED   NUMBER(10, 0),
    PRICEEACH         NUMBER(10, 2),
    ORDERLINENUMBER   NUMBER(10, 2),
    SALES             NUMBER(10, 2),
    ORDERDATE         DATE,
    STATUS            VARCHAR(50),
    QTR_ID            NUMBER(2, 0),
    MONTH_ID          NUMBER(2, 0),
    YEAR_ID           NUMBER(4, 0),
    PRODUCTLINE       VARCHAR(100),
    MSRP              VARCHAR(100),
    PRODUCTCODE       VARCHAR(100),
    CUSTOMERNAME      VARCHAR(100),
    PHONE             VARCHAR(100),
    ADDRESSLINE1      VARCHAR(100),
    ADDRESSLINE2      VARCHAR(100),
    CITY              VARCHAR(100),
    STATE             VARCHAR(100),
    POSTALCODE        VARCHAR(100),
    COUNTRY           VARCHAR(100),
    TERRITORY         VARCHAR(100),
    CONTACTLASTNAME   VARCHAR(100),
    CONTACTFIRSTNAME  VARCHAR(100),
    DEALSIZE          VARCHAR(100)
);
Create ODBC Connection in PowerBI Desktop
In this step, we will use the Devart ODBC for Oracle driver to establish the connection bridge between PowerBI Desktop and Oracle Database Engine. Ensure the PowerBI Desktop is completely installed.
- Open PowerBI Desktop -> Click Get Data -> after the Get Data window appears -> Choose Others. On the left panel, there is a list of PowerBI-supported drivers.
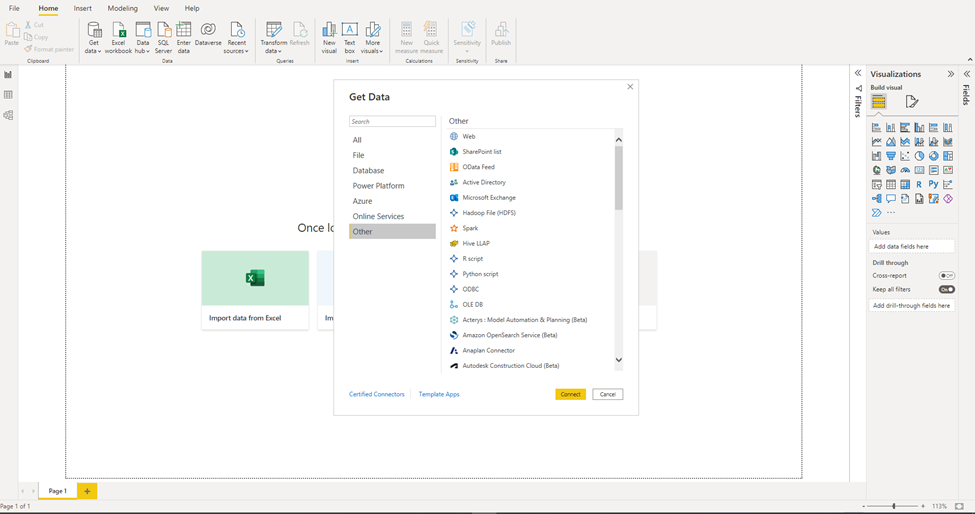
- Choose ODBC driver -> Connect
- From the Data Source dropdown list -> Choose the DNS: Devart_ODBC_Oracle which was created in the Driver Configuration section of this article.
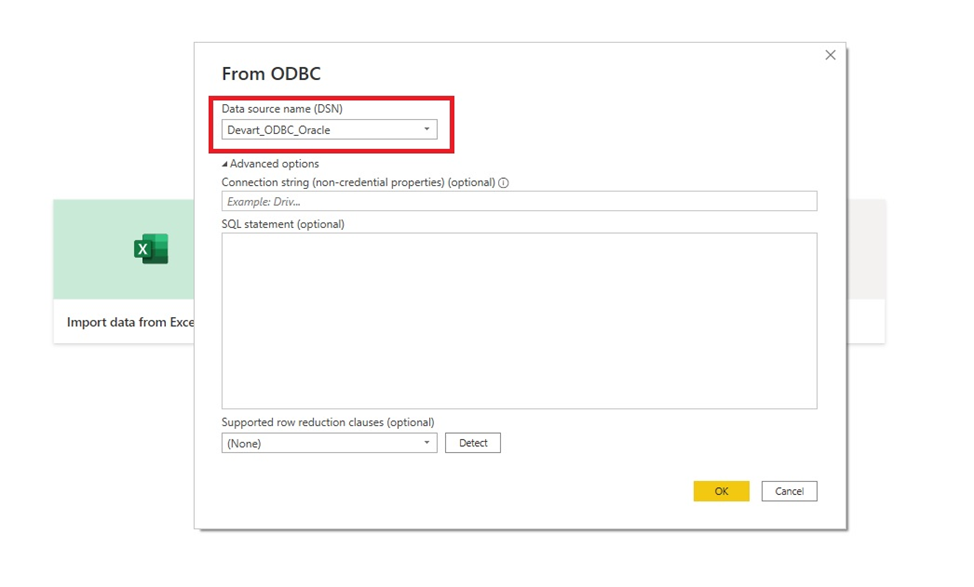
- Click OK. Then enter username and password if they are required
- Click Connect. A Navigator window appears and we will add the Sales table to PowerBI Desktop
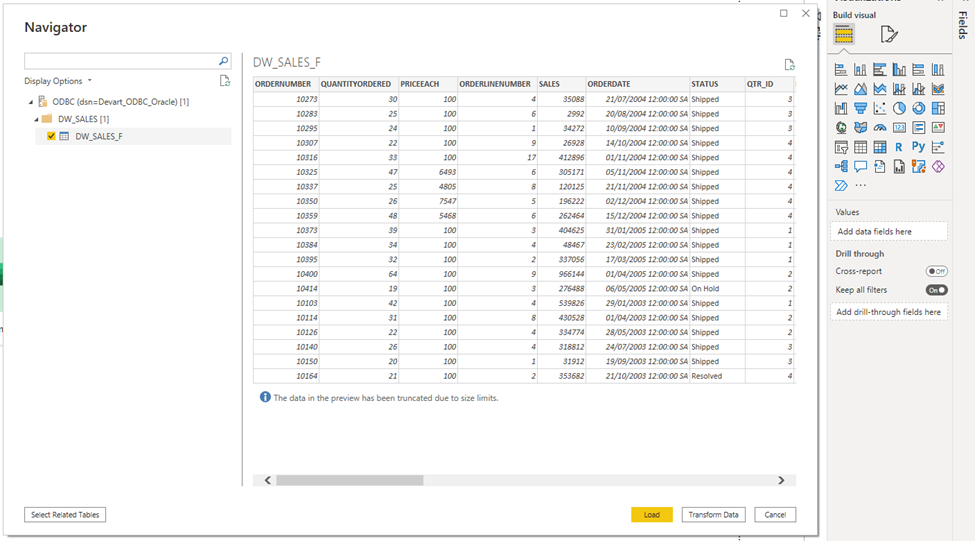
- Click Transform Data. In this step, we rename the column name for better readability
- Right-click on the Column header -> Rename
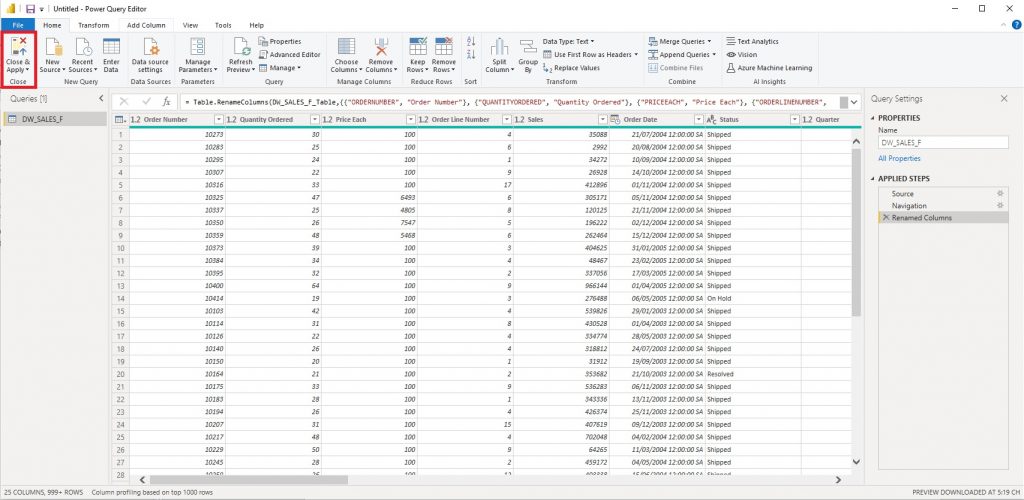
- Click on Close & Apply. Now, we can start building Prediction Sales Analytics in PowerBI Desktop.
- Right-click on the dataset in the Fields panel and rename it to Sales
Build Sales Analytics
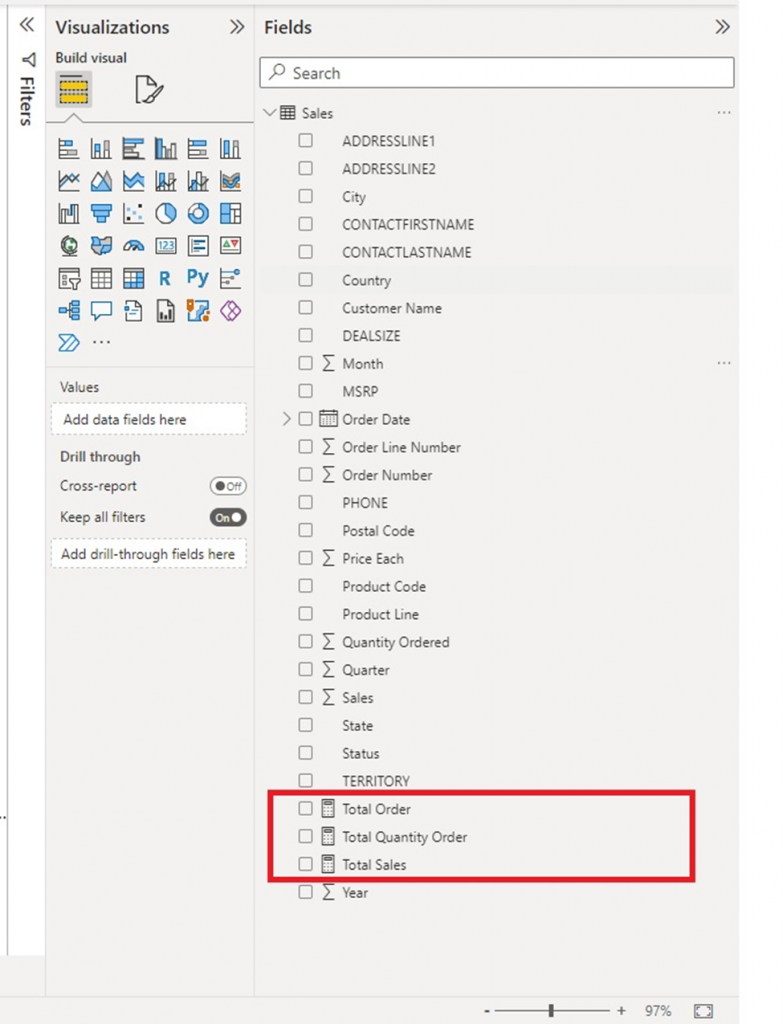
- Before building any reports we need to create some measures in PowerBI.
- Click on the dataset -> Create new measures by following formulas:
- Total Sales = SUM(Sales[Sales])
- Total Quantity Order = SUM(Sales[Quantity Ordered])
- Total Order = DISTINCTCOUNT(Sales[Order Number])
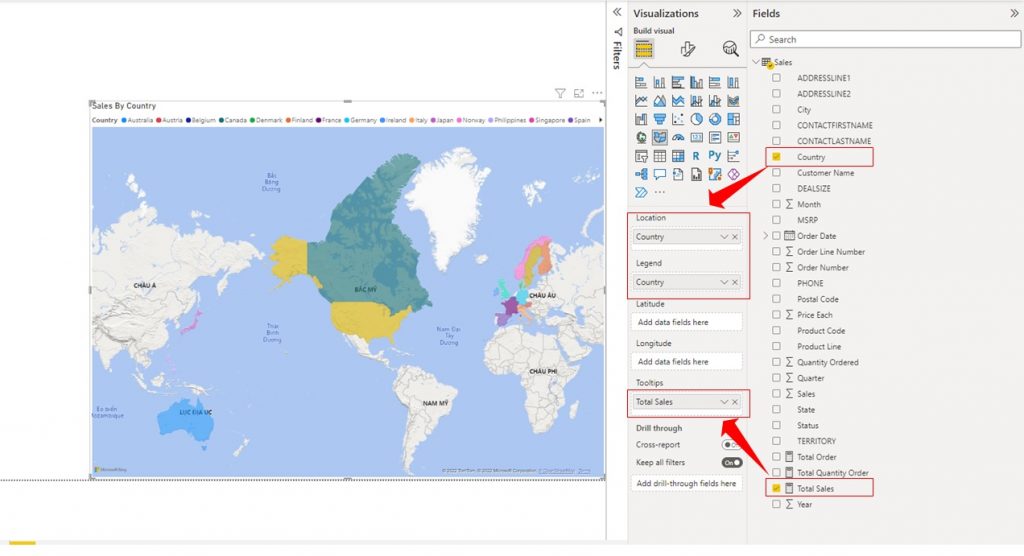
- Let’s build the first visualization based on the sales data in the Oracle database
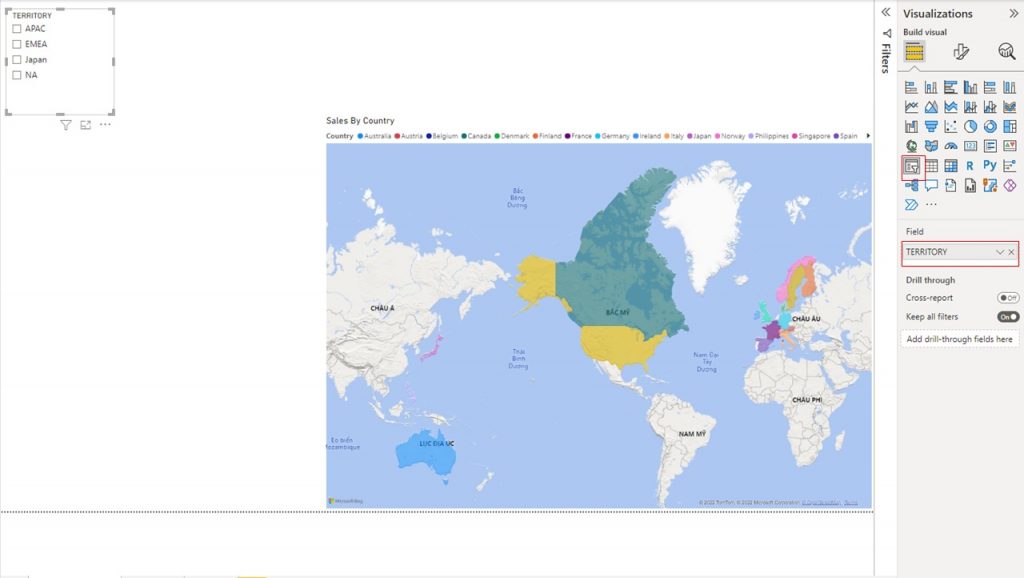
- Create a new canvas: Sales By Country
- Create a map chart by choosing Map chart in the Visualization panel
- Drag and drop Country from Sales to Location and Legend
- Drag and drop Total Sales from the Sales dataset to Tooltips
- Create a Slicer to filter Territory. On the Visualizations panel, select Slicer chart type then drag and drop Territory to Field.
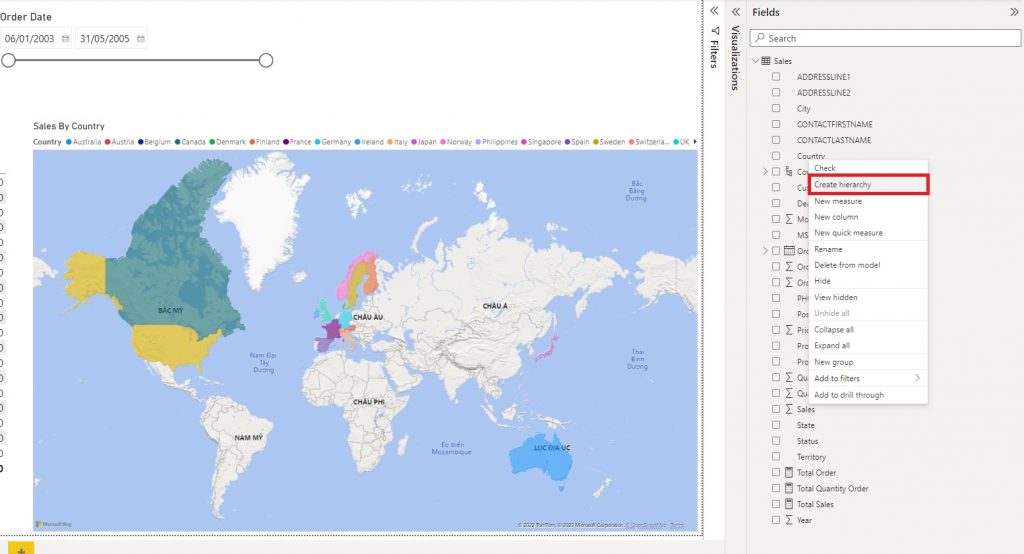
- Continue creating a new Slicer to filter Order Date
- Right-click on Country -> Create Hierarchy to create a Country Hierarchy with the following structure
- Country -> State -> City
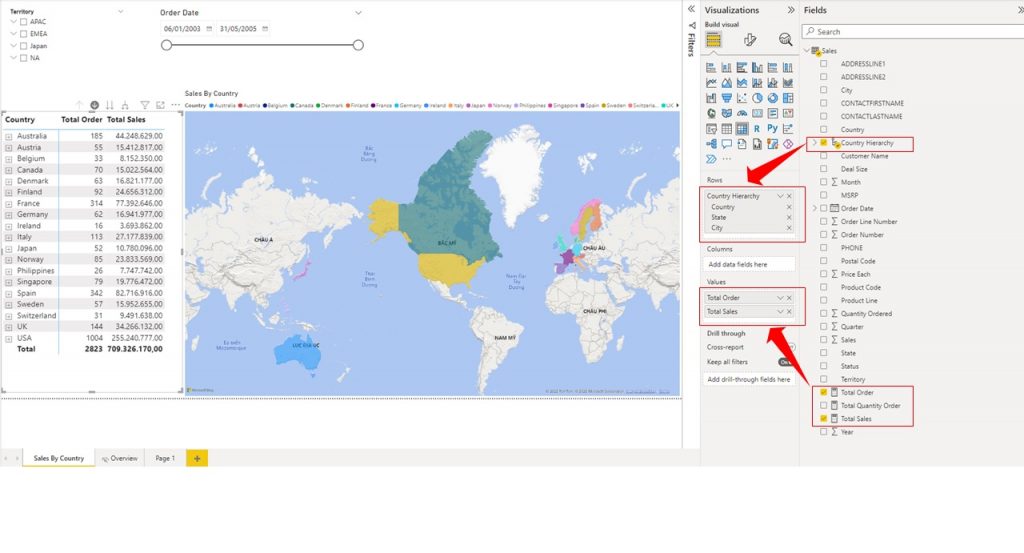
- Right-click on State -> Add to Hierarchy -> Choose Country Hierarchy
- Right-click on City -> Add to Hierarchy -> Choose Country Hierarchy
- Now, we create a new Pivot visualization. Then drag and drop Country Hierarchy to Rows and Total Order, Total Sales to values
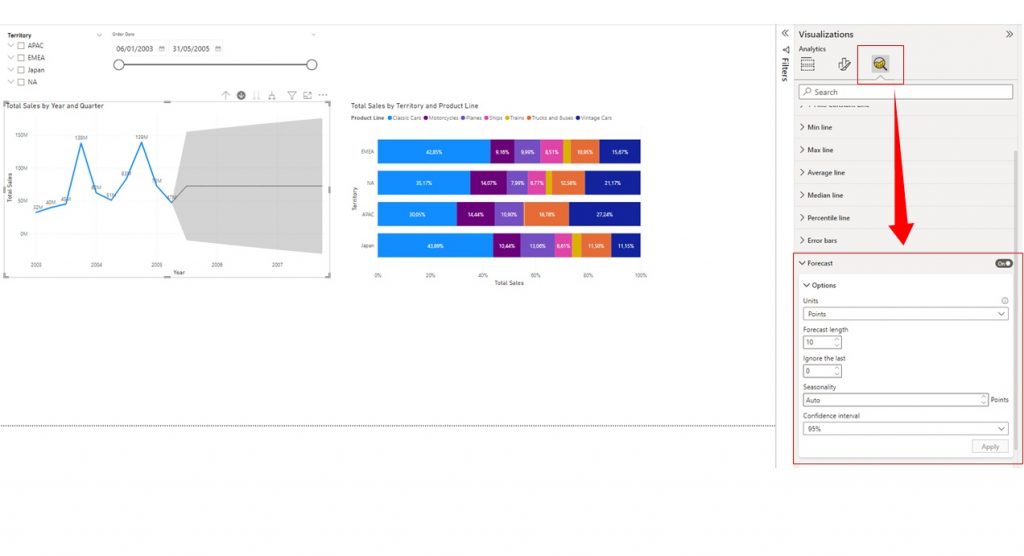
- Continue creating new canvas Sales By Product. In this canvas, we will analyze Sales By Product by creating a Line chart for forecasting Total Sales by Year, and a 100% Stacked Bar chart to analyze the % Share of each Product Line by Territory.
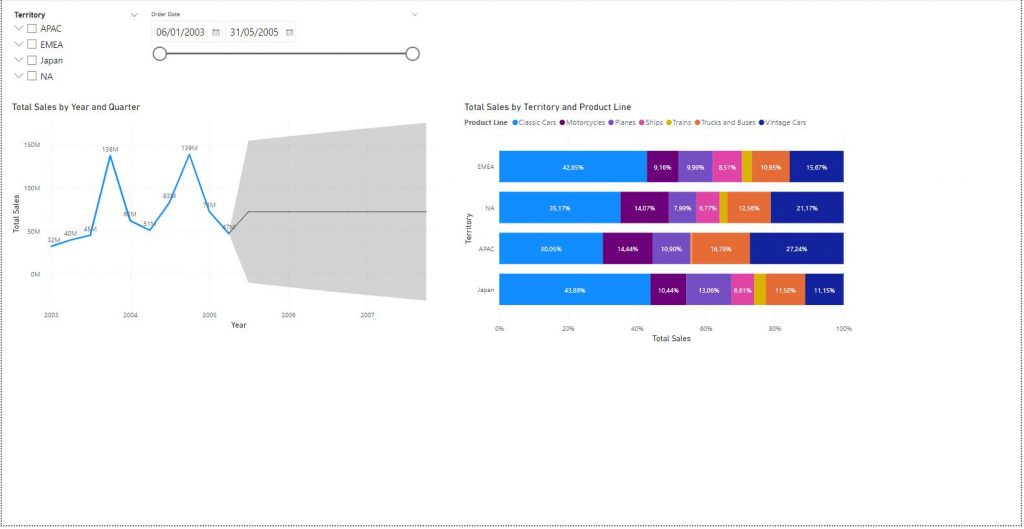
- When we create the Line chart for Total Sales by Order Date, we are able to add Forecast line to forecast Sales Amount for next three years.
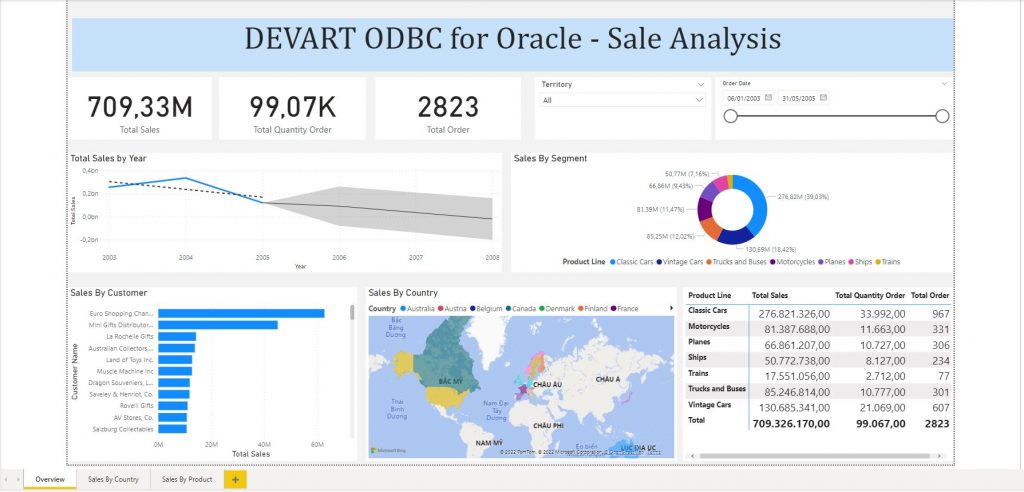
- In the next step, we will need a new canvas to analyze the overview insights.
Conclusion
Devart ODBC Driver for Oracle is a high-performance connectivity solution with enterprise-level features for accessing Oracle databases from ODBC-compliant reporting, analytics, BI, and ETL tools on both 32-bit and 64-bit Windows, macOS, and Linux. It will suit both small- and large-scale businesses, and come to the rescue even if you have literally loads of data to process. In this article, you discovered how easy it is to connect to the database, fetch all data you require, and neatly visualize it for the general audience, with graphs, bells, and whistles. Don’t wait for other signs – proceed to seamless connection and high performance right now!