The article provides a detailed overview of the SQL Debugger functionality built into dbForge Studio for SQL Server, a powerful IDE for efficient database development, administration, testing, and deployment boasting superb features and functionalities.
Debugging is an essential part of SQL Server database development. It allows developers to detect and fix bugs in their code. With a dedicated debugger, it is easier to understand what the bug is, where it has occurred, and what has caused it.
In the article, we will describe the following:
- How does the dbForge Studio’s Debugger work?
- Requirements to start debugging
- How to debug a stored procedure
- Debug a stored procedure directly from the code in a SQL document
- Conclusion

How does the dbForge Studio’s Debugger work?
SQL Debugger built into dbForge Studio for SQL Server is a reliable tool that can help you prevent issues and software faults before they might happen by analyzing the runtime behavior of database objects. The debugger allows you to find logic errors in T-SQL scripts, stored procedures, triggers, and functions by checking the code execution line by line. The tool also supports browsing call stack, setting breakpoints, as well as evaluating and modifying variables, and analyzing changes. With SQL Debugger, you can be sure that your code works as expected and won’t be stuck with any bugs.
Requirements to start debugging
When you try to start SQL Debugger, make sure that the following requirements are met:
- Server-side and client-side components of T-SQL Debugger have been installed.
- Debugging firewall exceptions have been enabled on the client and server sides.
- You are connected to a Database Engine SQL document using the Windows Authentication or SQL Server Authentication login being a member of the sysadmin fixed server role.
- A Database Engine SQL document is connected to an instance of the Database Engine from SQL Server 2005 Service Pack 2 (SP2) or higher.
- Client and server sides must be on the same subnet because Firewall does not allow RPC on remote computers (that are not on the same subnet).
- You cannot work with the database in a single-user mode.
Note: The Debugger does not work with Azure SQL databases.
Now, we are going to demonstrate how easy it is to debug a stored procedure with the help of the SQL Debugger available in dbForge Studio for SQL Server, as well as how to debug a stored procedure directly from the SQL document.
Prerequisites
For demo purposes, we will use the spShowOddNumbers stored procedure, which returns all odd numbers from a given range.
IF OBJECT_ID(N'dbo.OddNumbers', N'U') IS NOT NULL DROP TABLE [dbo].[OddNumbers];
CREATE TABLE dbo.OddNumbers	(Odd_Numbers INT PRIMARY KEY);
GO
CREATE TRIGGER TrInsNumber ON [dbo].[OddNumbers] AFTER INSERT AS PRINT 'Row inserted';
GO
CREATE OR ALTER PROCEDURE dbo.spInsOddNumbers @VarIns INT
AS
	BEGIN
		INSERT INTO OddNumbers VALUES (	@VarIns	)
	END
GO
CREATE OR ALTER PROCEDURE dbo.spShowOddNumbers
	@LowerRange INT,
	@UpperRange INT
AS
	BEGIN
	SET NOCOUNT ON
		DECLARE @TempVar INT
		SET @TempVar = @LowerRange
		WHILE (@TempVar < @UpperRange)
			BEGIN
				IF (@TempVar % 2 != 0)
					BEGIN
						PRINT @TempVar
						EXECUTE spInsOddNumbers @VarIns = @TempVar
						END
				SET @TempVar = @TempVar + 1
			END
		PRINT 'PRINTED ODD NUMBERS BETWEEN ' + RTRIM(@LowerRange) + ' and ' + RTRIM(@UpperRange)
		SELECT * FROM OddNumbers;
		TRUNCATE TABLE OddNumbers;
		SET NOCOUNT OFF
	END
GO
How to debug a stored procedure
Open dbForge Studio for SQL Server. To start debugging, in Database Explorer, right-click the stored procedure for debugging and select Step Into.
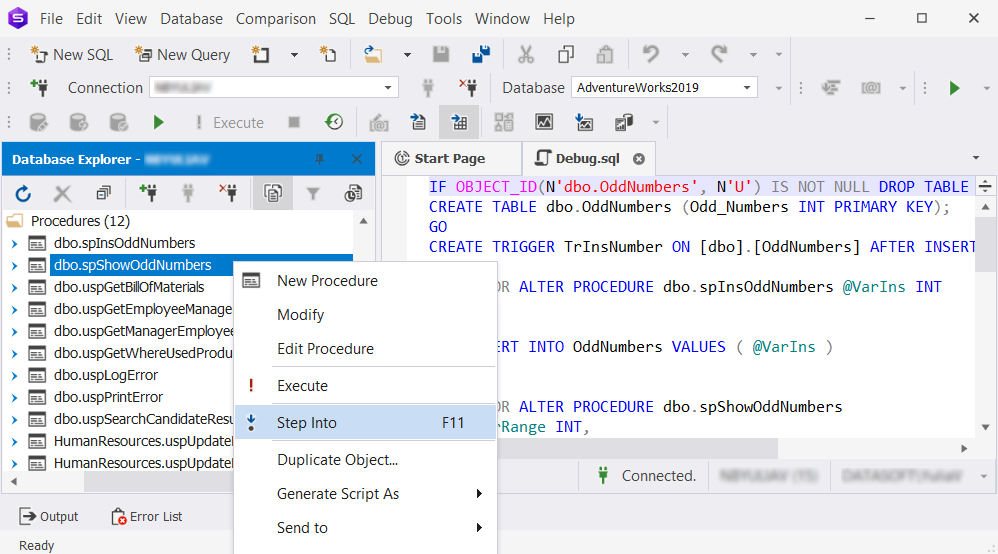
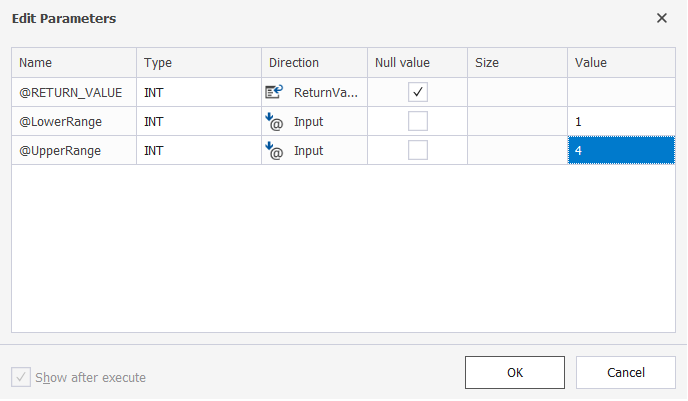
The Edit Parameters dialog opens where you can quickly add values of input variables. In the dialog, you can execute or debug a procedure without declaring the values of variables in the script.
So next, assign values 1 and 4 for the LowerRange and UpperRange variables respectively, and then click OK.
Note: @LowerRange and @UpperRange define the range of values.
After that, you need to click F11 to start debugging the procedure step by step.
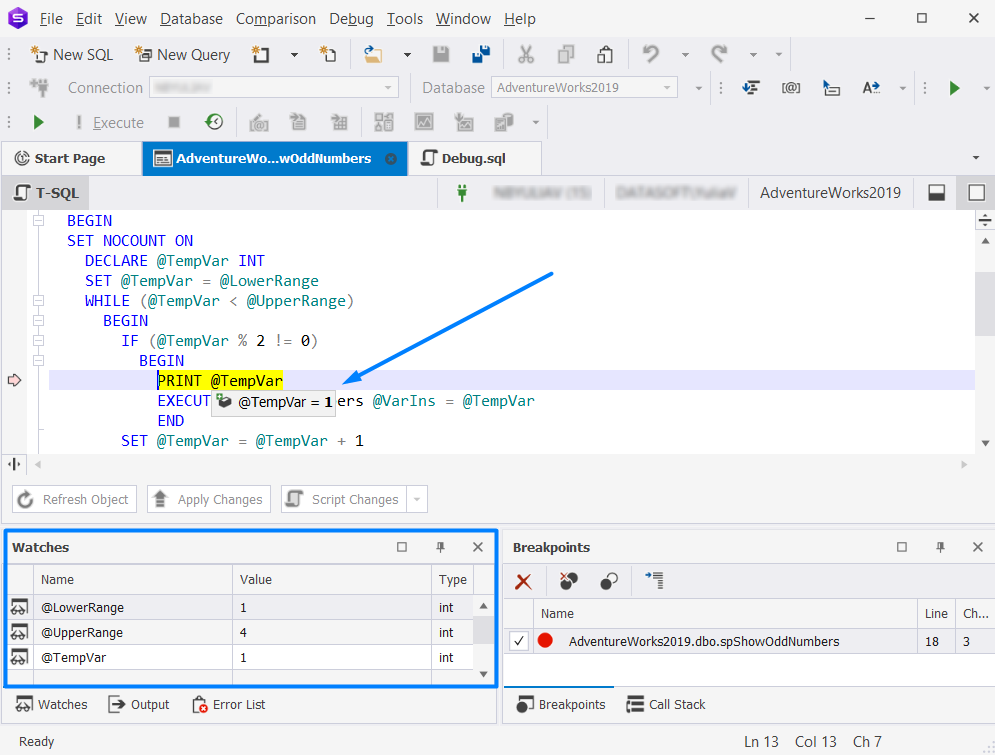
During debugging, you can monitor the variable values. To do that, you need to add these variables to the Watches pane.
Step 1: Add variables to the Watches pane
In the SQL Debugger document, right-click the variables which values you want to track and then select Add Watch.
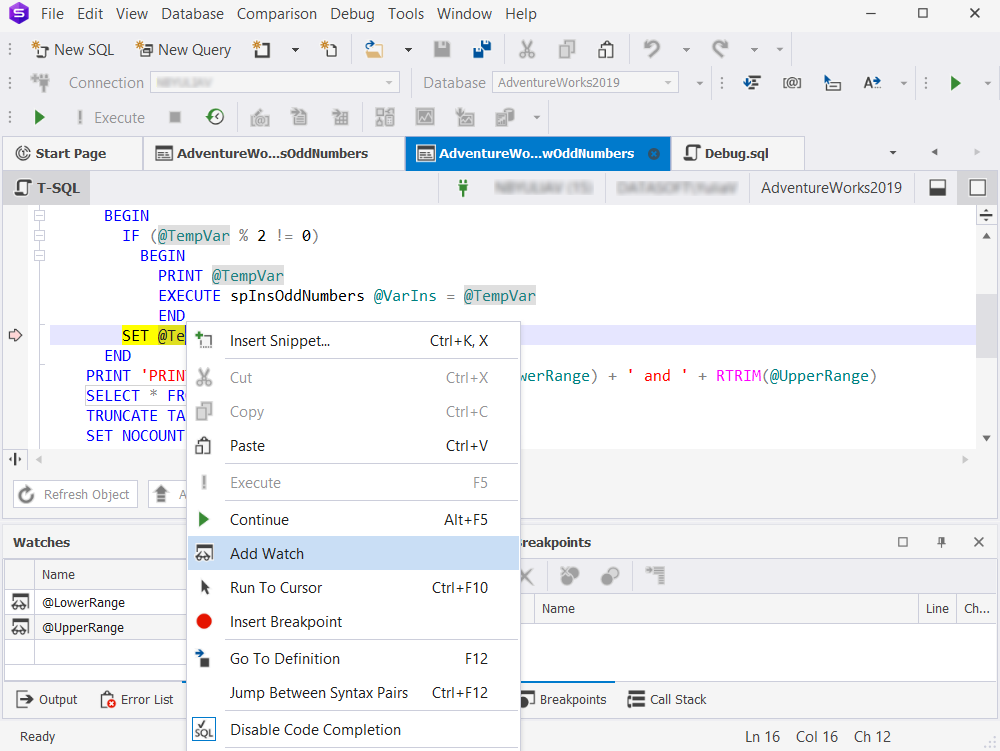
As you can see, we set the watches to the following variables: @LowerRange, @UpperRange, and @TempVar. The variables along with their values and data types are now displayed in the Add Watches pane.
Step 2: Set breakpoints
During debugging, you can set breakpoints to break or pause debugger execution on any line of executable code. All the breakpoints and their properties will be displayed in the Breakpoints pane.
Let’s see how to manage breakpoints. First, set a breakpoint on the following line of the code:
SET @TempVar = @TempVar + 1You can insert a breakpoint using one of the following ways:
- Right-click the line which you want to break at and click Insert Breakpoint.
- On the Debug menu, click Toggle Breakpoint.
- In the gray bar to the left, click the line you want to break at.
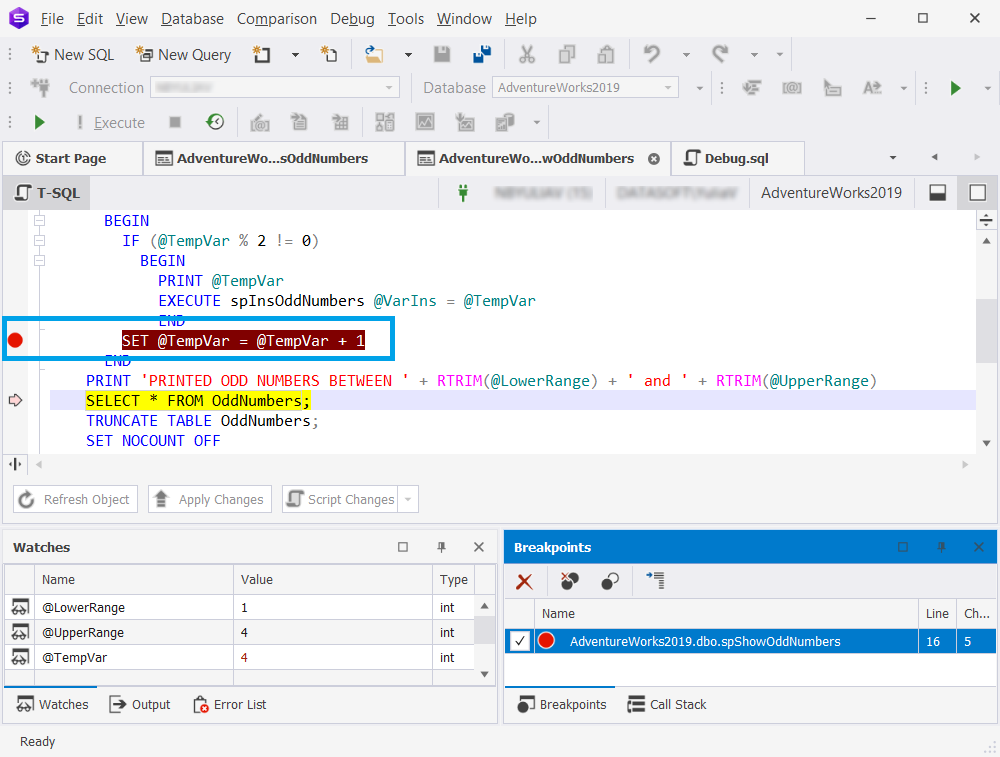
As you can see, the breakpoint is now displayed in the gray bar to the left of the statement and in the Breakpoints pane. Also, you can view the breakpoint status as enabled or disabled.
Note: If you do not need a breakpoint any longer, you can disable or remove breakpoints by using the toolbar in the Breakpoints pane. Alternatively, you can remove the breakpoint by right-clicking the breakpoint you want to delete and selecting Delete Breakpoint.

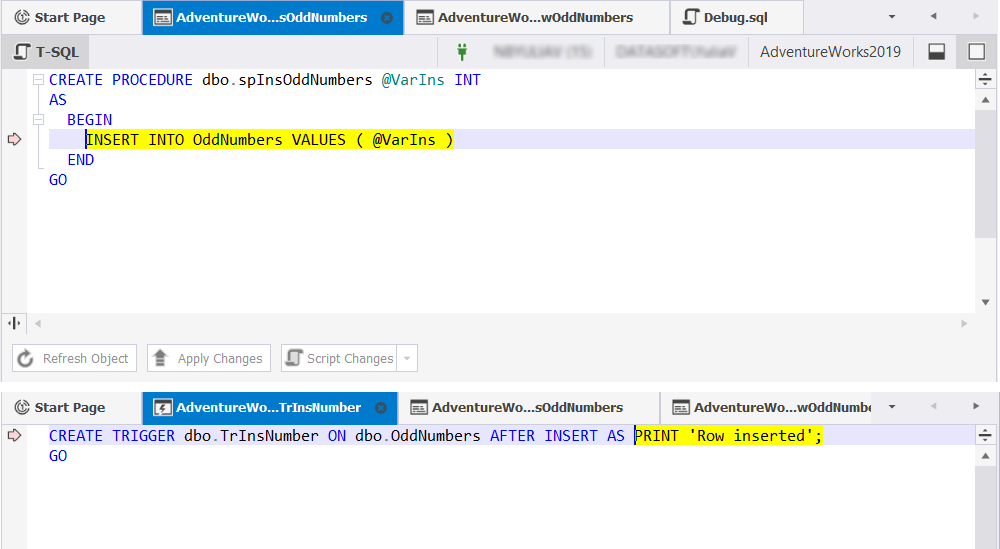
Step 3: Debug dependent objects
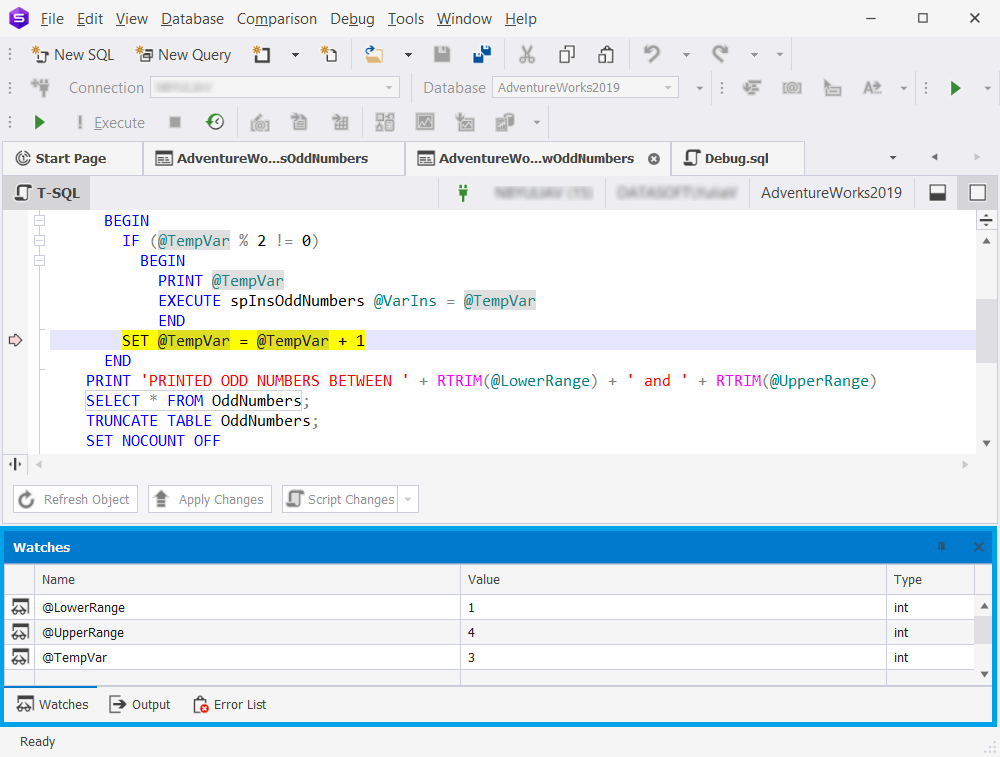
After inserting breakpoints, we can keep on debugging by clicking Step Into on the Debug menu or pressing F11. Meanwhile, you can see how the values of variables are being changed in the Watches pane. Also, you can hover over the variable to view the current value of the variable in the hint.
It should be noted that if you debug the procedure that triggers the execution of the dependent database objects, debugging of these objects will start automatically.
In our example, the spShowOddNumbers procedure triggers the spInsOddNumbers procedure that inserts values into the OddNumbers table. It, in turn, starts the TrInsNumber trigger that is being debugged too. Thus, during the debugging of the spInsOddNumbers procedure, all dependent objects will be under debugging as shown in the screenshot.
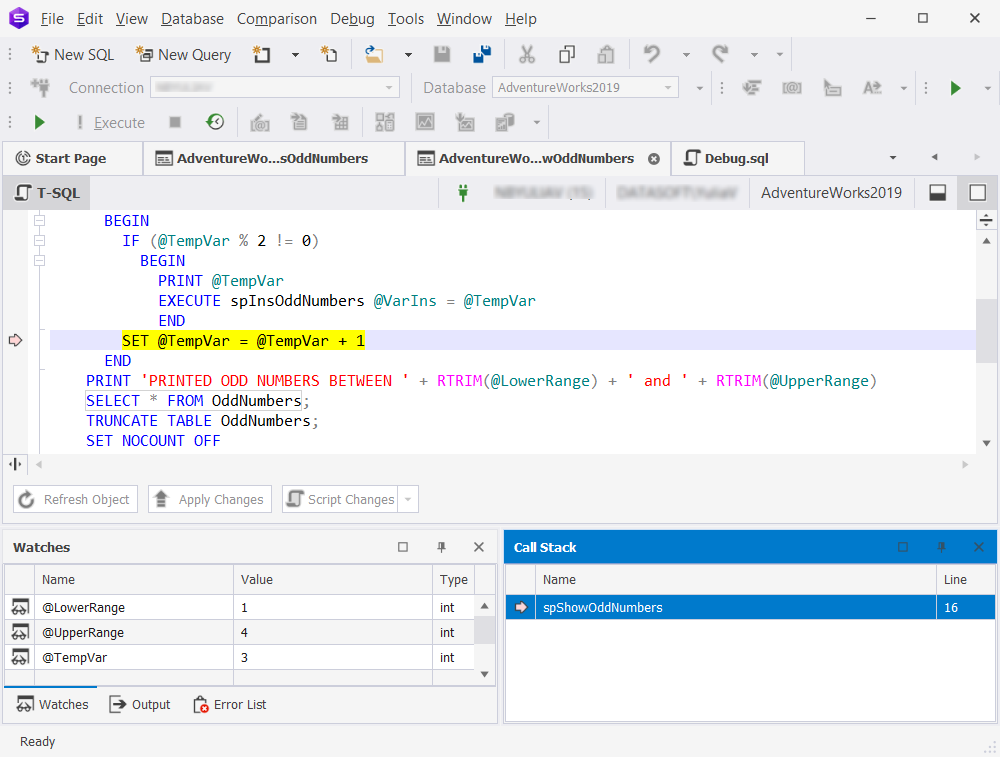
In the SQL Debugger, you can also view information about the database objects being debugged in the Call Stack pane. It displays the procedure calls that are currently on the stack. The yellow arrow refers to the line of the code where the debugger is currently located.
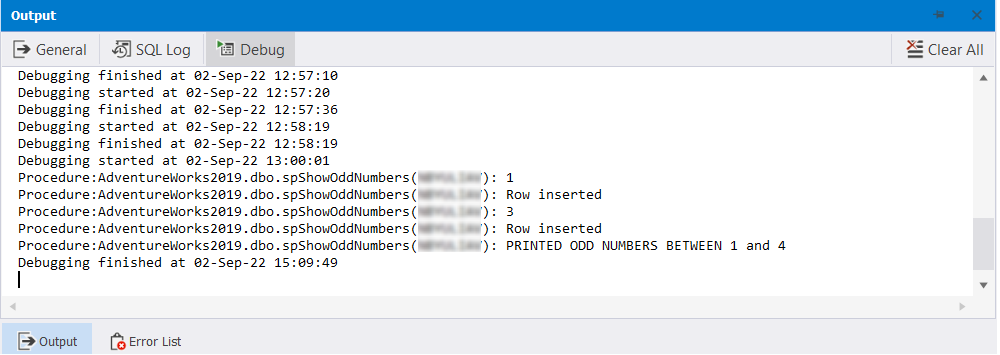
Step 4: Analyze the result
When debugging is complete, the Output pane automatically opens displaying the execution result of procedure debugging. This allows you to examine the result and understand what can be done to avoid errors in your code.
With SQL Debugger, you can debug the procedure directly from the SQL document. Now, it is time to see how to do that.
Debug a stored procedure from a SQL document
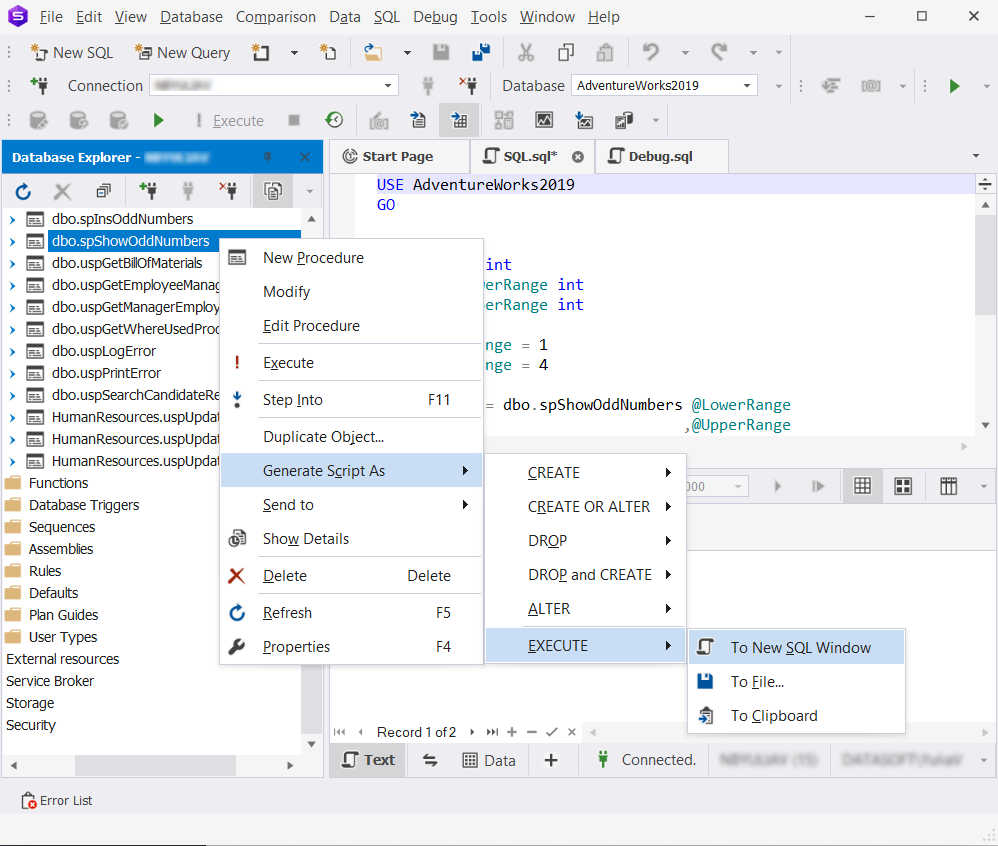
You can also debug a stored procedure directly from the code in the SQL document with the help of the built-in script generation feature. To do that, in Database Explorer, right-click the procedure you want to debug and select Generate Script As > EXECUTE > To New SQL Window.
As you can see, a script to debug the procedure has been generated in a new SQL document.
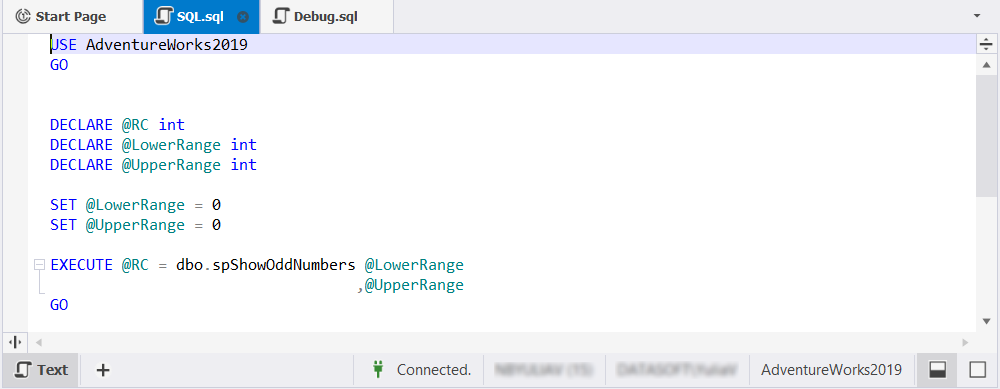
In the SQL document, assign the values 1 and 4 for the LowerRange and UpperRange variables respectively, and then press F11. This will let the debugger go through the variables one by one and step into the called procedure to debug it.
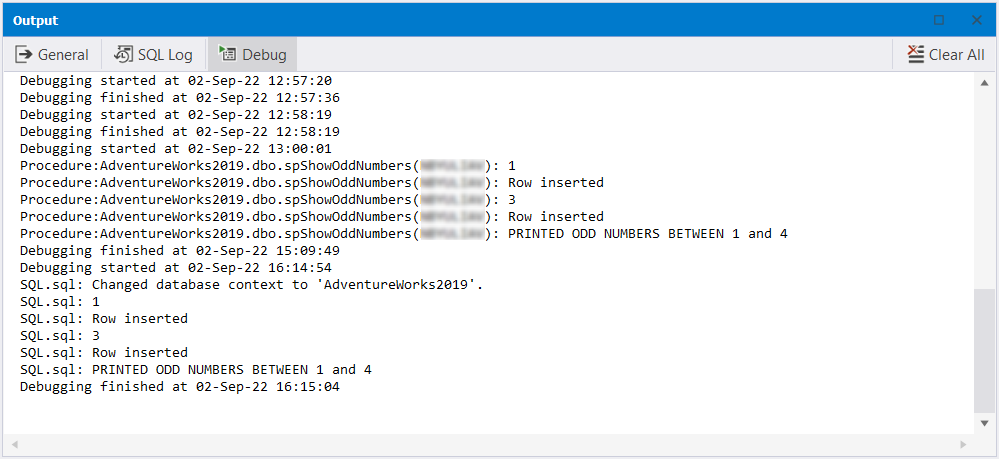
After debugging is over, the Output pane opens automatically where you can view and analyze the result of the debugging process.
Conclusion
As you can see, debugging of stored procedures, functions, and triggers with SQL Debugger built into dbForge Studio for SQL Server is simple, quick, and efficient. The tool can easily test your code for any errors, unexpected behavior, or adverse effects.
Want to see how SQL Debugger works? Download a free 30-day trial version of dbForge Studio for SQL Server to evaluate the capabilities of the tool. While working with the tool, you will definitely enjoy it and after its expiration, you don’t want to part with it.
Learn more about SQL Server decryptor.