
What is the purpose of query logging in MySQL? Why is it important? How do you enable and configure it? In this article, we will address these questions and more. You will find a detailed guide on how to use mysqldumpslow to analyze slow query logs, along with tips on harnessing convenient GUI tools like dbForge Studio for MySQL to your advantage.
Contents
- Enabling MySQL query log
- Configuring the slow query log
- Using mysqldumpslow to analyze slow query logs
- How to enable MySQL query log using dbForge Studio for MySQL by Devart
- Conclusion
As promised, we will begin this article by answering the first question: what is the purpose of query logging in MySQL? Just like any other system, a database is doing its thing, constantly changing and sometimes malfunctioning, unfortunately. Wouldn’t it be nice to know why? This is exactly where query logging comes in handy. By logging queries, especially slow ones, you can see which operations are consuming the most resources, helping you optimize performance. It also plays a huge part in troubleshooting, allowing you to trace problematic queries that may be causing errors or slowdowns.
Note: Check out our Show running processes in MySQL article to maximize your optimization game.
Enabling MySQL query log
The second question on today’s agenda was: how do you go about enabling MySQL query log? Essentially, there are two ways to do it:
- Edit the MySQL configuration file.
- Execute the corresponding MySQL command.
Below, you will find the detailed instructions on how to do both.
Editing the MySQL configuration file
In order to make changes to the MySQL configuration file:
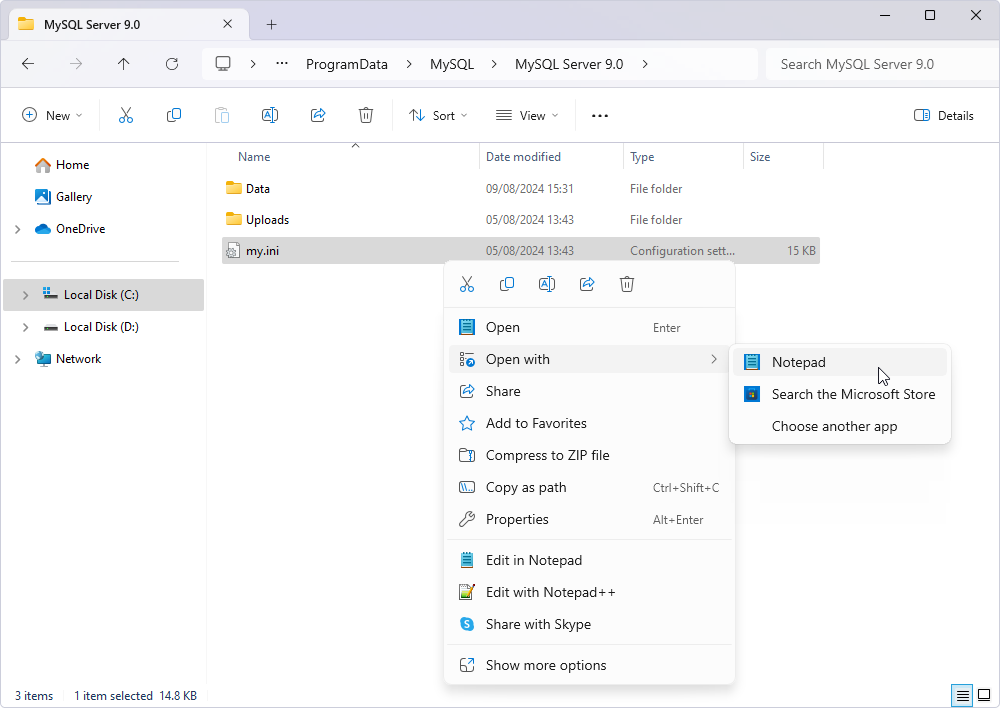
1. Find the my.ini file. By default, it is located in the C:/ProgramData/MySQL/MySQL Server 9.0/my.ini directory.
2. Right-click the file and open it with a text editor of your liking. We will stick to the classics and open it with Notepad:
3. Inside the file, find the [mysqld] section. Here, add the following parameters:
general_log=1

general_log_file="general.log"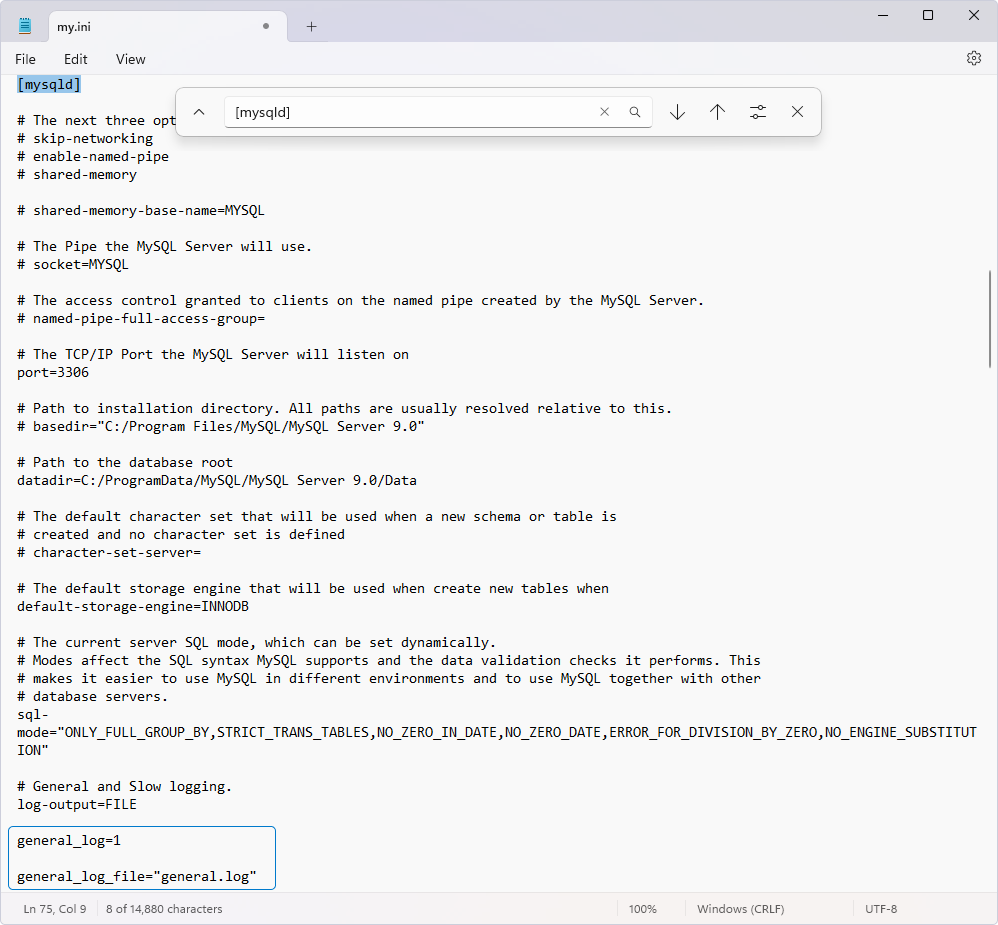
4. Save and close the file.
5. Restart the MySQL service to apply the changes.
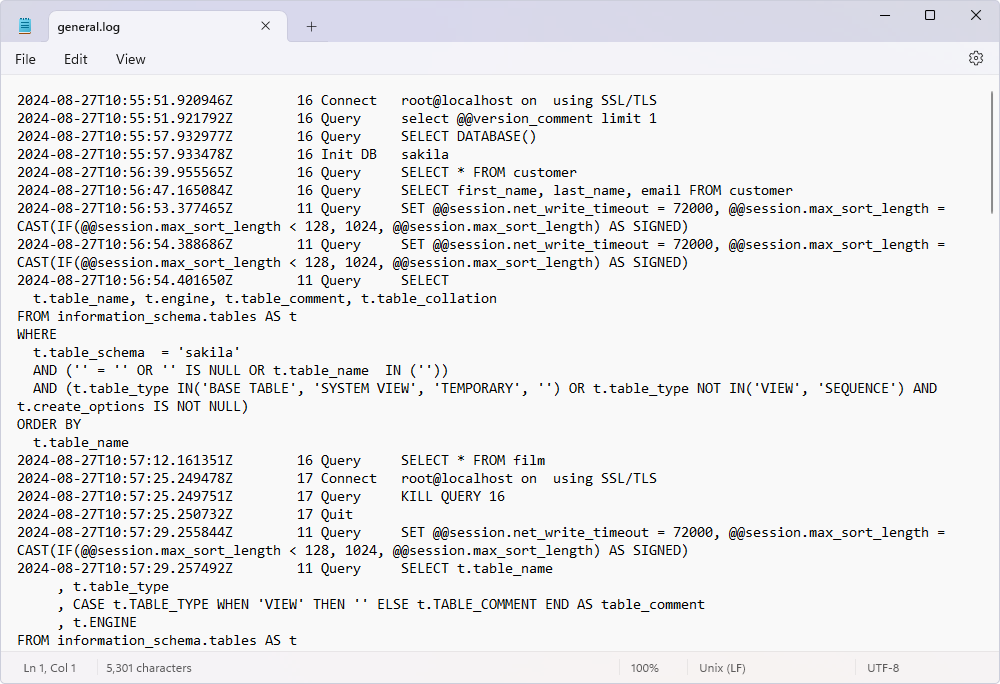
Now, the general query log is enabled, and all queries executed on the MySQL server will be logged in the specified log file:
Using MySQL commands
1. Start by logging into your MySQL server.
2. Before making any changes, you might want to check if the general query log is already enabled.
SHOW VARIABLES LIKE 'general_log';
SHOW VARIABLES LIKE 'general_log_file';
3. If it is not already on, you can change that by executing the following command:
SET GLOBAL general_log = 'ON';By the way, utilizing a MySQL debugger can significantly streamline the process of identifying and resolving issues within your queries.
4. Specify the file where the logs should be written. You can set this to any path where the MySQL server has write access.
SET GLOBAL general_log_file = 'C:/ProgramData/MySQL/MySQL Server 9.0/Data/general.log';Replace 'C:/ProgramData/MySQL/MySQL Server 9.0/Data/general.log' with the actual path where you want to store the log file.
5. To ensure that the logging is enabled and the file path is correctly set, run the following:
SHOW VARIABLES LIKE 'general_log';
SHOW VARIABLES LIKE 'general_log_file';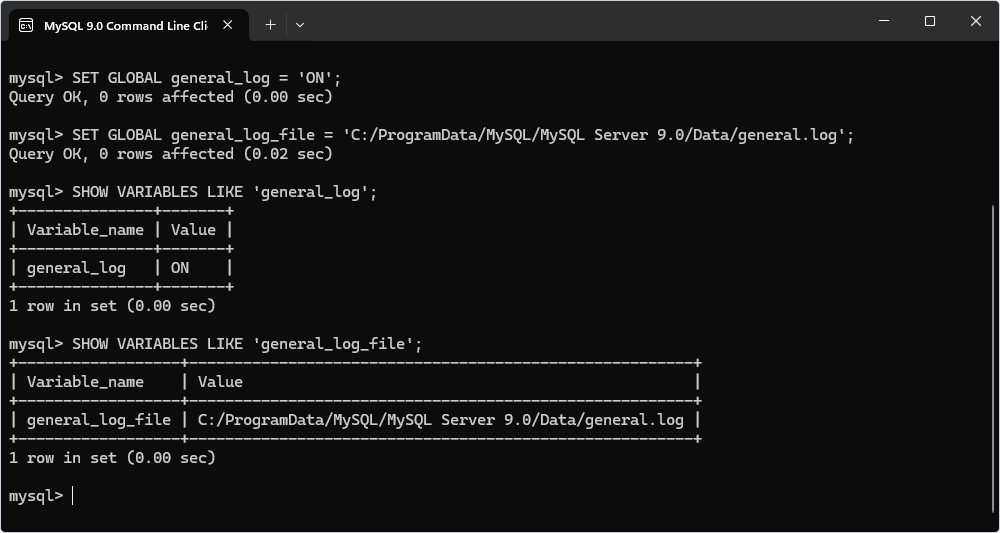
6. Once you no longer need query logging, you can turn it off to avoid unnecessary disk usage.
SET GLOBAL general_log = 'OFF';Note: You may need root or sudo access to view or modify the log file if stored in a restricted directory.
Configuring the slow query log
Having in mind the MySQL query log enabling procedure, we can now move on to configuring the slow query log. It is going to be easy for us since the steps are rather similar.
Purpose of the slow query log
As the name suggests, the slow query log in MySQL is a tool that registers queries that take longer than a specified amount of time to execute. By analyzing these logs, you can spot inefficient queries and optimize them, finding bottlenecks and improving overall database performance.
Enabling the slow query log using the configuration file
To enable the slow query log in MySQL, you need to modify the my.ini configuration file again.
1. Open the my.ini file in a text editor.
2. In the [mysqld] section, add the following parameters:
slow_query_log=1

slow_query_log_file="slow.log"
3. Save the changes and restart the MySQL server.
Setting slow query log parameters
Being “slow” is a rather relative concept. Thus, we need to define it for MySQL. To fine-tune the slow query log, set the long_query_time additional parameter, which defines the threshold for what is considered a slow query.
long_query_time=2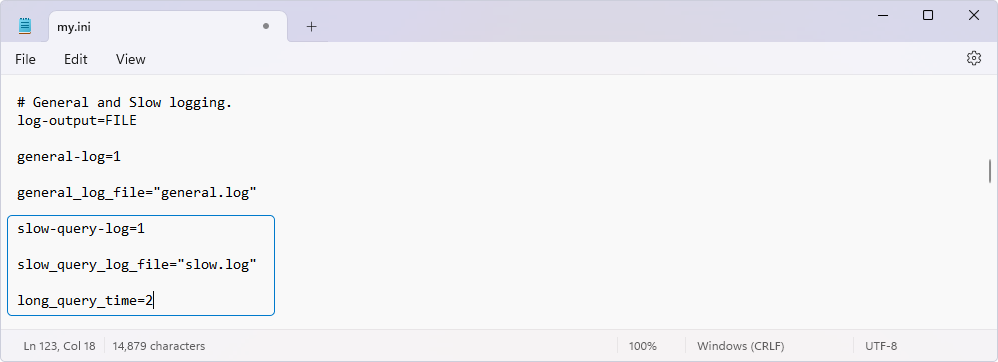
After completing these steps, you should see all the queries that take longer than 2 seconds logged in the slow.log file.
Get insights into MySQL log types, their use cases and advantages — view MySQL logs tutorial.
Using mysqldumpslow to analyze slow query logs
Just documenting all the slow-running queries in MySQL is not enough. To make a huge step towards actually optimizing the performance, you can try the mysqldumpslow tool.
Overview of mysqldumpslow
mysqldumpslow is a utility that helps you summarize and analyze the slow query logs generated by MySQL. Normally, it groups queries that are similar except for the particular values of number and string data values.
The basic syntax looks somewhat like this:
mysqldumpslow [options] [log_file ...]The supported options are:
| Option | Description |
| -a | Do not abstract all numbers to N and strings to ‘S’. |
| -n | Abstract numbers with at least the specified digits. |
| –debug | Write debugging information. |
| -g | Only consider statements that match the pattern. |
| –help | Display help message and exit. |
| -h | Specify the host name of the server in the log file name. |
| -i | Specify the name of the server instance. |
| -l | Do not subtract lock time from total time. |
| -r | Reverse the sort order. |
| -s | Sort output. |
| -t | Display only first num queries. |
| –verbose | Enable verbose mode. |
Summarizing slow query logs
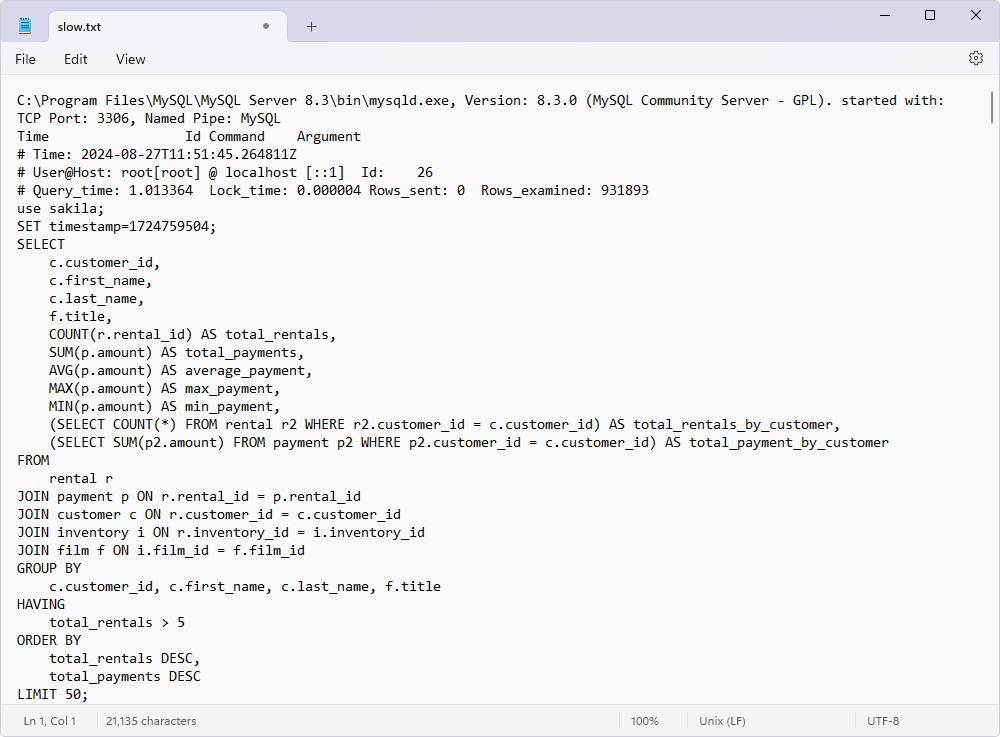
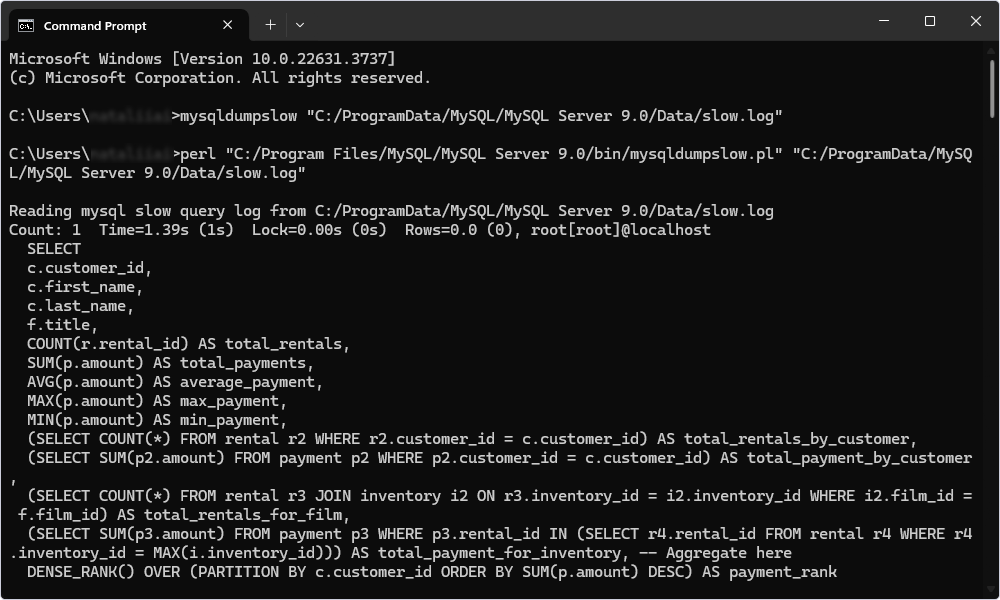
Let us get a general summary of the slow log. To do that, open Windows Command Prompt and execute the following query:
mysqldumpslow "C:/ProgramData/MySQL/MySQL Server 9.0/Data/slow.log"You should see the entire content of the slow.log file:
However, if you need, say, only the top 3 slowest queries, run the following command:
mysqldumpslow -t 3 "C:/ProgramData/MySQL/MySQL Server 9.0/Data/slow.log"You can also group queries by fingerprint to see the most frequent slow queries:
mysqldumpslow -a "C:/ProgramData/MySQL/MySQL Server 9.0/Data/slow.log"Keep in mind that you need the Perl environment installed on your Windows machine for the mysqldumpslow command to operate. Otherwise, you will be getting an error message instead of the expected output.
- Download and install Strawberry Perl.
- Open Command Prompt and execute the
perl -vcommand to see if the environment was installed properly. - Create a mysqldumpslow.bat file in the C:\Windows\ directory.
- Copy and paste this text into the newly created file
perl "C:/Program Files/MySQL/MySQL Server 9.0/bin/mysqldumpslow.pl" %*. - Save the mysqldumpslow.bat file.
- Restart the Command Prompt, and feel free to play with mysqldumpslow however you’d like.
How to enable MySQL query log using dbForge Studio for MySQL by Devart
GUI tools provide a user-friendly alternative to executing MySQL code directly for those who prefer a more visual and intuitive approach to database management. That is precisely what we are going to talk about next.
Overview of dbForge Studio for MySQL
dbForge Studio for MySQL is a convenient IDE designed to make MySQL database development and administration tasks a piece of cake. One of its standout features is the ability to perform complex operations, such as enabling and configuring MySQL query logs.
Step-by-step guide to enabling the query log
Since dbForge Studio was specifically created to improve your experience through a visual approach to database management and administration, there is more than one way to see and analyze the query log.
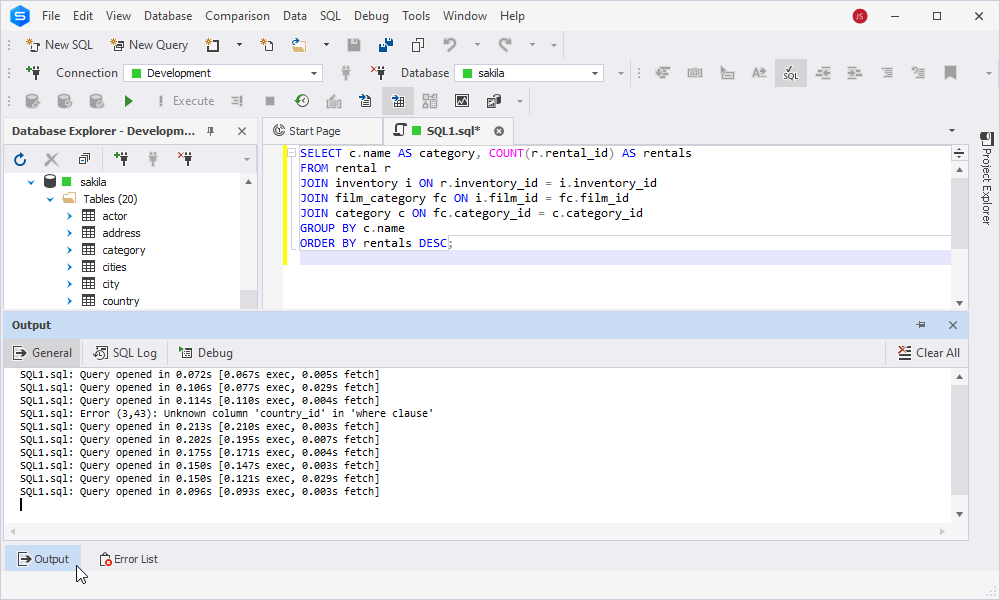
The first and basic one would be checking status messages and errors that are logged to the Output window. Errors are not only logged to the Output window but are also shown in the Error List window.
The second one is more advanced. You can use the query optimization tool provided by dbForge Studio — Query Profiler. It can help you profile and improve MySQL query performance, as well as track the differences in profiling results when executing the query several times. Detect slow-running queries, examine the workload, and analyze bottlenecks to resolve performance issues in MySQL databases. Profiling can also be used to determine the unexpected behavior of queries.
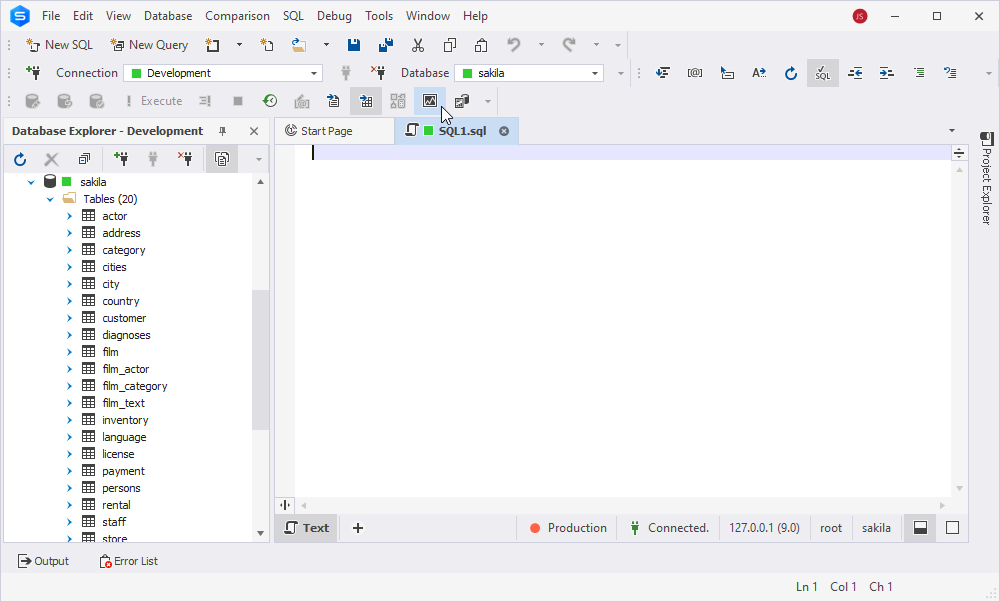
To activate the Query Profiler:
1. Click the Query Profiling Mode button on the SQL toolbar.
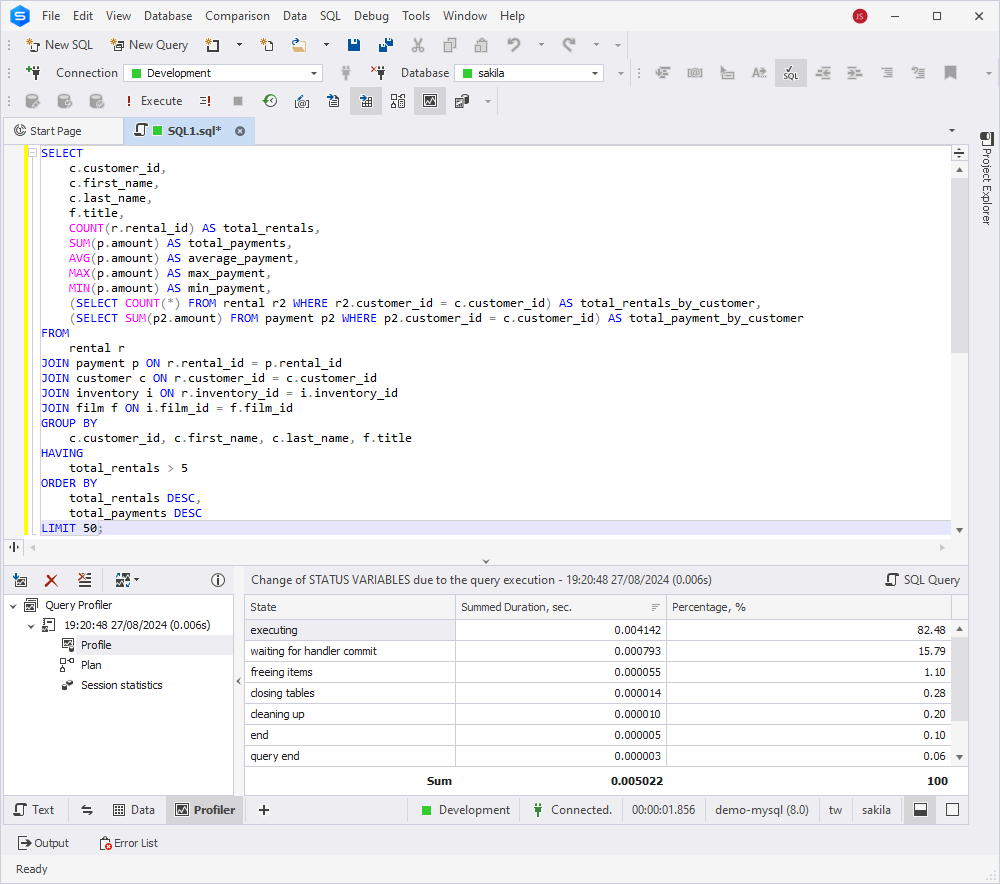
2. Execute the query by clicking the Execute button or pressing F5. In our case, we will be using this query:
SELECT
c.customer_id,
c.first_name,
c.last_name,
f.title,
COUNT(r.rental_id) AS total_rentals,
SUM(p.amount) AS total_payments,
AVG(p.amount) AS average_payment,
MAX(p.amount) AS max_payment,
MIN(p.amount) AS min_payment,
(SELECT COUNT(*) FROM rental r2 WHERE r2.customer_id = c.customer_id) AS total_rentals_by_customer,
(SELECT SUM(p2.amount) FROM payment p2 WHERE p2.customer_id = c.customer_id) AS total_payment_by_customer
FROM
rental r
JOIN payment p ON r.rental_id = p.rental_id
JOIN customer c ON r.customer_id = c.customer_id
JOIN inventory i ON r.inventory_id = i.inventory_id
JOIN film f ON i.film_id = f.film_id
GROUP BY
c.customer_id, c.first_name, c.last_name, f.title
HAVING
total_rentals > 5
ORDER BY
total_rentals DESC,
total_payments DESC
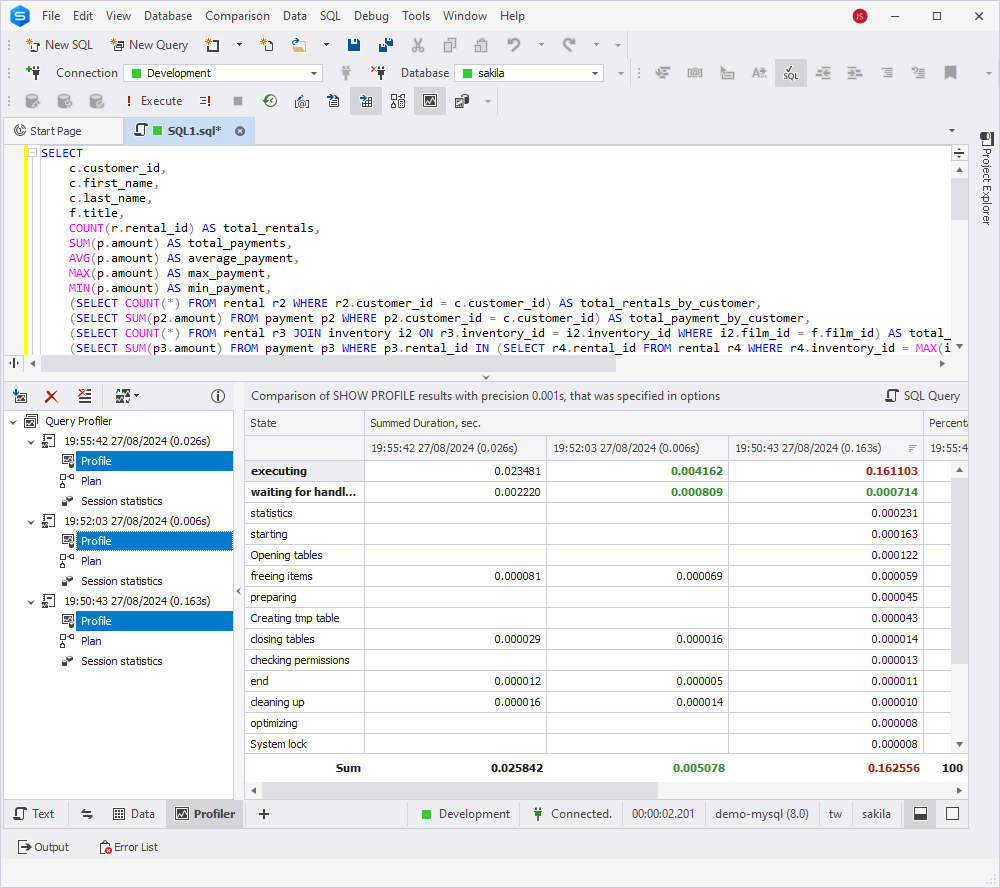
LIMIT 50;The Profile tab
As you can see, the profiling results are displayed conveniently on a separate tab of your SQL document, so you can easily navigate to your query and other tabs if needed without switching to additional windows and documents.
Query Profiler keeps the query text along with its profiling results to let you optimize MySQL queries effectively. You need to select a required profiling result and click SQL Query. With the query changes history, you can return to any step of the query optimization, review, execute, or save the query.
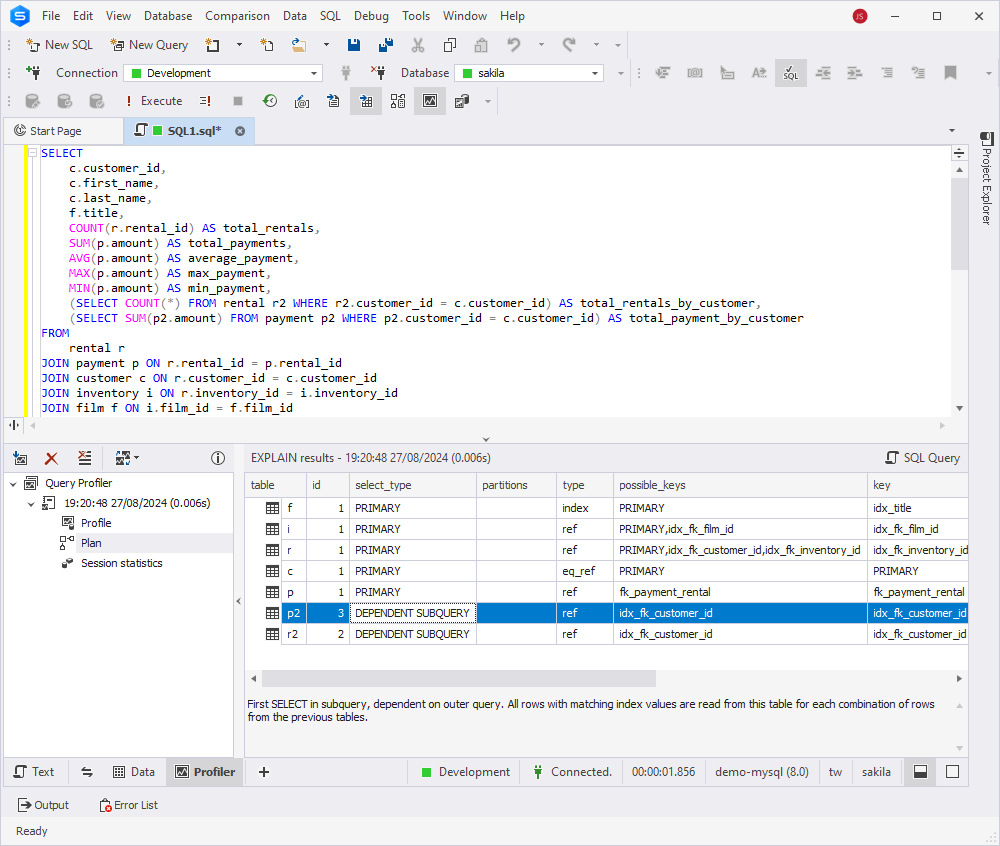
The Plan tab
Use the MySQL EXPLAIN plan to achieve better query performance with the least resource consumption. It provides a comprehensive view of how operations are executed, including the sequence in which tables are joined and accessed for optimal performance in MySQL databases. Additionally, it shows the time taken to process the rows involved in each operation.
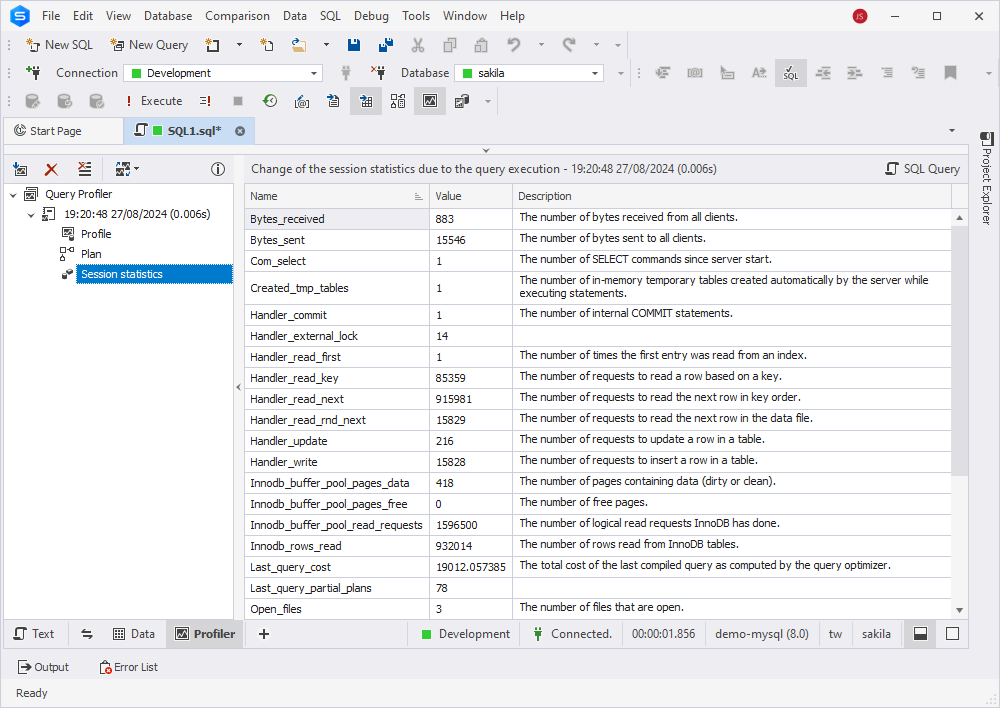
The Session Statistics tab
Query Profiler automatically compares STATUS variables for the required query before and after execution in the Session Statistics tab of the Query Profiler tree. This type of data is displayed as a grid and is applicable to the current connection. This information allows you to monitor MySQL query performance to decide where to search for bottlenecks and optimize MySQL queries.
Query profiling results comparison
Upon analyzing the query profiling results, we see several issues that require our attention. Let’s talk about one of them for the sake of science.
For example, the following two subqueries are correlated and are executed for each row in the outer query:
(SELECT COUNT(*) FROM rental r2 WHERE r2.customer_id = c.customer_id)(SELECT SUM(p2.amount) FROM payment p2 WHERE p2.customer_id = c.customer_id)
This can severely impact performance, especially with large datasets. What we can do in this case is rewrite these subqueries as JOINs or pre-aggregated views to reduce the computational overhead.
Having made changes in the query, let us click the Get New Results button in the Profiler document view. New profiling results appear in the tree view as a new node with the time and date of query execution. The key to optimizing MySQL queries is to see the differences in profiling results after your changes. Select profiling results for two query executions by holding the CTRL key and get the differences highlighted in the grid.
Note: If you are looking for major performance tuning techniques, we have just a thing for you! You will find helpful optimization tips and tricks on our website. Moreover, you can learn how to troubleshoot MySQL performance with slow query log on our YouTube channel:
Conclusion
In this article, we talked about different ways to enable and configure query logging in MySQL. Depending on your personal style, you can choose from editing the configuration file, using MySQL commands, or opting for an IDE like dbForge Studio for MySQL with its invaluable Query Profiler feature. It is a query optimization tool that helps you profile and improve MySQL query performance, as well as track the differences in profiling results when executing the query several times. Give it a try by downloading a 30-day free trial!