Sooner or later, every developer and DBA will face the necessity of finding out the reasons for slow database performance. This article will take a detailed look at how to set up MySQL Server logging and write commands to show MySQL logs that were enabled. You will get detailed instructions on how to check MySQL logs, what types of MySQL Server logs exist, and what tools can assist you with log management and automation or log rotation. Keep reading to dive in!
Contents
- MySQL log types
- Accessing MySQL logs on different operating systems
- Getting started with MySQL logs
- Working with the error log
- Working with the binary log
- Working with the general log
- Working with the slow query log
- Tools for viewing MySQL logs
- Best practices for managing MySQL logs
- Automating log rotation and maintenance
- Conclusion
MySQL log types
The log is the first place to look to determine your system status and identify errors. MySQL has several different log files that can help you with that.
Error log
The error log contains a record of errors that occur when the server is running (including the ones happening when it starts and stops working).
- What it records. Server startup/shutdown events, critical errors, failed connections, crashes, and other issues.
- Why it matters. If MySQL isn’t working correctly, the error log is the first place to check for clues.
Binary log
The binary log records statements that change the database data. It is used for backups and replication.
- What it records. Changes to the database (INSERT, UPDATE, DELETE) but not SELECT queries.
- Why it matters. Crucial for replication (syncing data across servers) and point-in-time recovery (restoring to a specific moment).
General query log
The general query log contains the established client connections and statements received from clients.
- What it records. Every query executed by MySQL, including client connections, disconnections, and SQL statements.
- Why it matters. Useful for debugging application behavior and tracking what’s happening in real time, but it can grow large quickly.
Slow query log
The slow query log records all the queries that take longer to run than the time interval you’ve assigned.
- What it records. Queries that take longer than a specified time (default: 10 seconds).
- Why it matters. Helps identify slow-performing queries so you can optimize them with indexes or query rewriting.
This chart will guide you on how to check MySQL logs depending on what information you are looking for.
| Log Type | Purpose | Default Location | Command to Access |
|---|---|---|---|
| Error Log | Records server startup, shutdown, and critical errors | /var/log/mysql/error.log (Linux) C:\ProgramData\MySQL\MySQL Server X.X\data\*.err (Windows) | SHOW VARIABLES LIKE ‘log_error’; Check OS logs (tail -f /var/log/mysql/error.log) |
| General Query Log | Logs all client connections and executed SQL queries | /var/log/mysql/mysql.log (Linux) C:\ProgramData\MySQL\MySQL Server X.X\data\*.log (Windows) | SET GLOBAL general_log = ON; SHOW VARIABLES LIKE ‘general_log_file’; |
| Slow Query Log | Captures queries exceeding a defined execution time | /var/log/mysql/slow.log (Linux) C:\ProgramData\MySQL\MySQL Server X.X\data\*.slow.log (Windows) | SET GLOBAL slow_query_log = ON; SHOW VARIABLES LIKE ‘slow_query_log_file’; |
| Binary Log | Records all changes to the database (for replication & recovery) | /var/lib/mysql/mysql-bin.* (Linux) C:\ProgramData\MySQL\MySQL Server X.X\data\mysql-bin.* (Windows) | SHOW BINARY LOGS |
However, if you are looking for detailed instructions on how to enable and disable MySQL logs, keep reading.
Accessing MySQL logs on different operating systems
Now, let’s check where you can typically find MySQL log files. The location of the file you are looking for may be different and depend on the operating system you use.
Windows OS
To locate the MySQL log files on Windows, check the path in the data directory specified in your my.ini file.
It might look like: C:\ProgramData\MySQL\MySQL Server [version number]\Data\
The location for each log is often the MySQL Data directory.
Linux
On UNIX/Linux, MySQL installations are mostly script-based with minimal interactive setup. Error logs are usually stored in /var/log/ or /var/log/mysql/ under names like error.log or mysqld.log. The data directory, often /var/lib/mysql/, serves as the default log destination unless specified otherwise.
MacOS
The location of the log files on MacOS might depend on your setup. However, the most common path is: /Applications/mysql/MySQL Server [version number]/agent/logs/
Getting started with MySQL logs
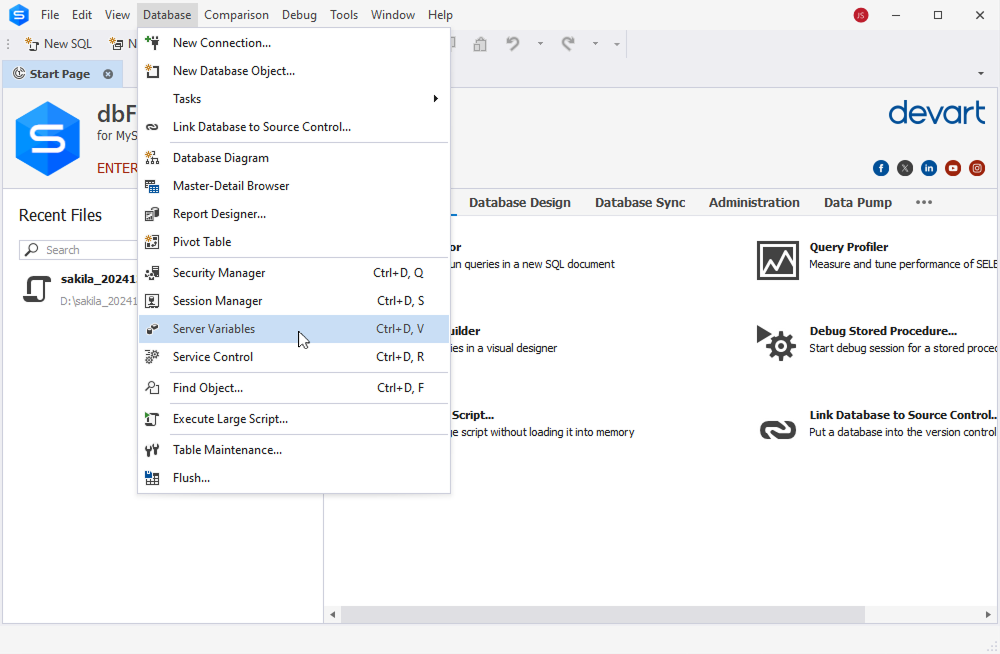
First, you need to get to know if logging is enabled and identify the MySQL log location. Using dbForge Studio for MySQL, you can find this information in seconds.
To view and modify MySQL system and status variables, go to the Database menu and select the Server Variables command from it. Alternatively, you can see the main configuration file my.cnf.
For more information, refer to the How to Enable, Configure, and Use MySQL Query Logging blog article.
Working with the error log
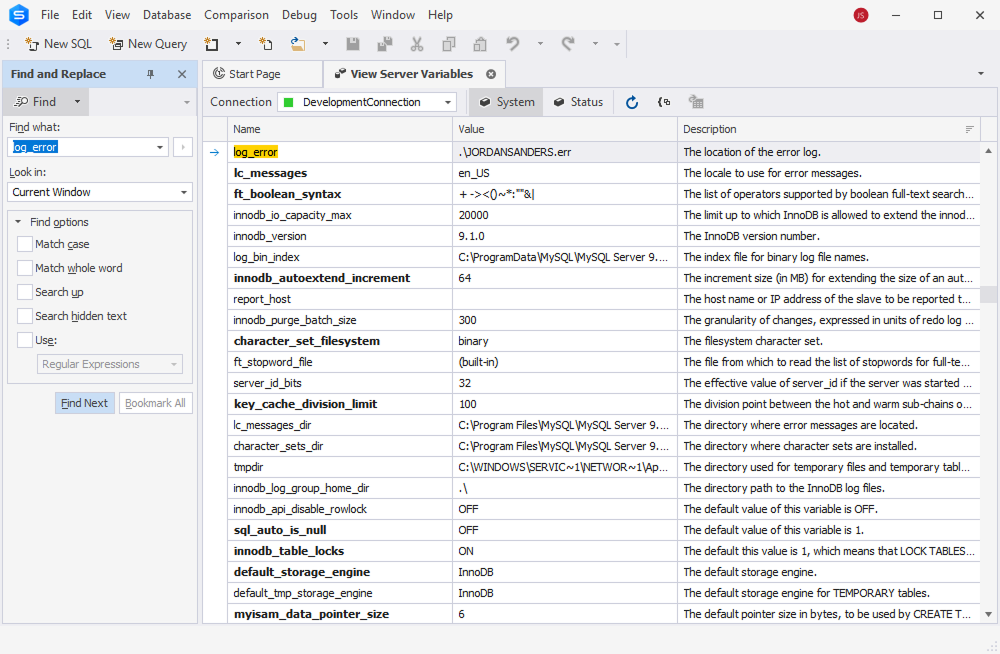
The error log contains all errors that occurred while the server was running, including critical errors and errors encountered when stopping and/or starting the server, as well as some warnings. In case of a system failure, it’s the first place to look for the reason. It is also useful to check the MySQL error log when debugging MySQL query performance. By default, all errors are sent to the console (stderr), you can also select to write errors to syslog (default in Debian), or a separate log file. You can find out its location by checking the value of the log_error system variable:
log_error=/var/log/mysql/error.logErrors are written to error.log
We highly recommend keeping this log enabled for quick identification of errors.
Working with the binary log
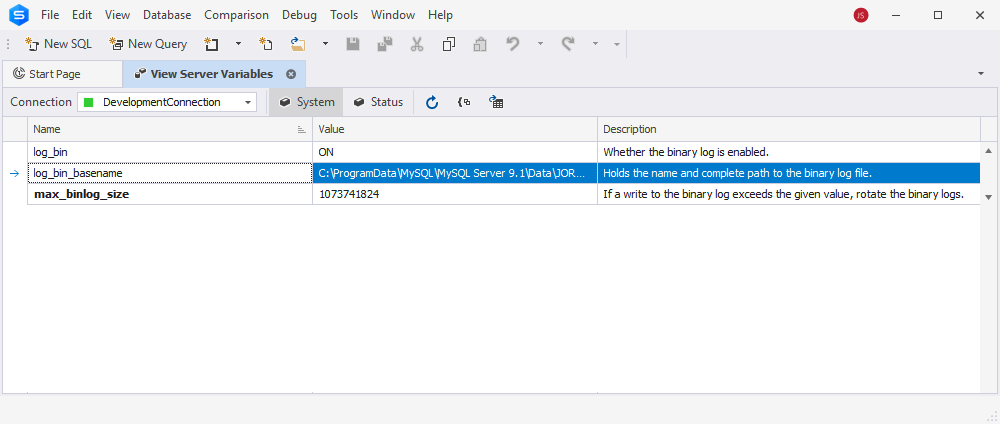
All statements that change the database data are written to the binary log. It is useful for database replication and recovery.
Options used with binary logging

The binary log is resource-intensive and slows down system performance. We recommend enabling it only if you are going to scale the system and implement fault tolerance.
Working with the general log
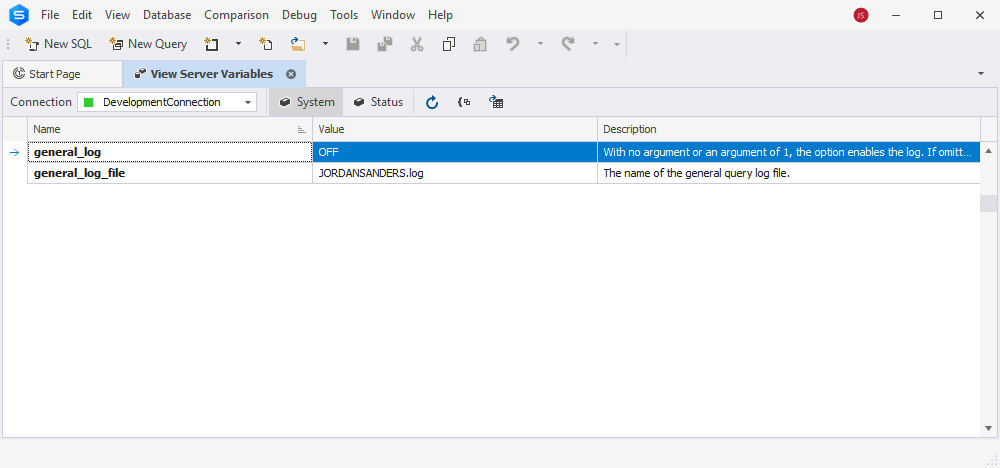
The general query log contains all received SQL queries and information about client connections. It can be useful for index analysis and optimization, as well as for detecting erroneous queries.
Options used with general query logging

The peculiarity of this type of logging is that it can be enabled or disabled while the MySQL server is running. You do not need to restart the MySQL Server after running the following statements.
SET GLOBAL general_log = 'ON';

SET GLOBAL general_log = 'OFF';
The general query log records all SQL queries to all databases on the server. Therefore, it can be very voluminous. We recommend you use it carefully and make sure that you do not run out of free space on the server.
Working with the slow query log
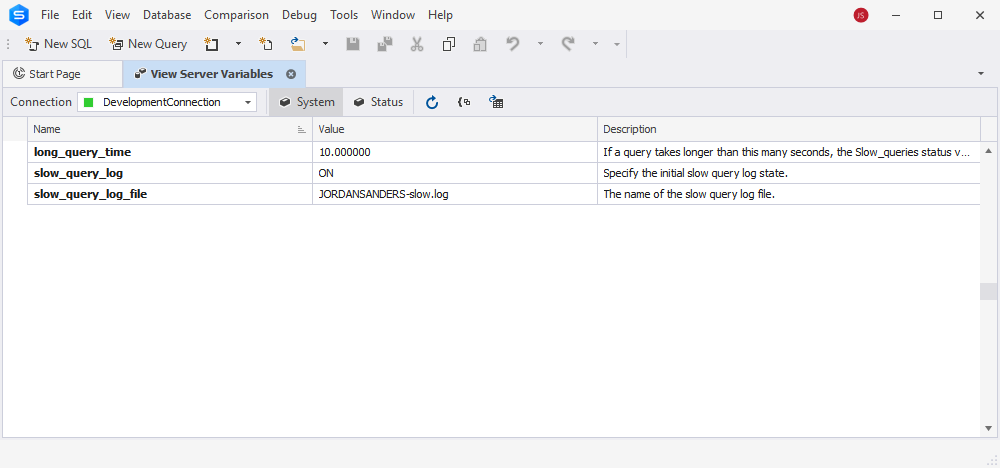
The Slow query log contains all SQL queries to all databases on the server that have been running for longer than long_query_time.
To enable slow query logging, you need to change the values of the system variables in MySQL and restart the MySQL instance for the changes to take effect.
To start logging, you need to set the value
slow_query_log ON
After that, all slow queries that need to be analyzed and optimized if necessary will be recorded in the file /var/log/mysql/test-VB-slow.log
Tools for viewing MySQL logs
When you open the MySQL log file, it’s easy to get lost in the vast masses of data. The more information you want added to your log, the more difficult it becomes to read and understand where an error has crept in. Luckily, there are plenty of tools for viewing MySQL logs to help these records make sense. Check the list of solutions that will let you navigate MySQL logs confidently and notice all the essential patterns.
- Datadog MySQL monitoring
Datadog is a comprehensive solution that comes with MySQL logs viewer functionality. This tool automatically sets up a log processing pipeline and extracts the data from your MySQL log for further searching, filtering, and sorting within its user-friendly interface. It allows you to transition from logs to application metrics and lets you request traces, providing valuable context for troubleshooting.
Price: from $15 per host per month.
- Logit.io
Logit.io provides a built-in MySQL log file analyser that can be used to collect, centralize and organize your data & set up alerts, helping you monitor your log data in real-time and deliver metrics for Kibana visualizations & reports with ease.
Price: from $12 per month.
- Loggy by SolarWinds
Loggy is a cloud-based log aggregator that lets you unify all your logs in one place and look across the entire stack with immediate results showing up. It works as a MySQL logs viewer, providing an interactive interface and comprehensive search capabilities with simple query language, significantly cutting troubleshooting time.
Price: limited free version.
- MySQL Enterprise Audit Log plugin
MySQL Enterprise Audit leverages the MySQL Audit API for policy-based monitoring, logging, and blocking of connection and query activity. It provides an out-of-the-box auditing solution for compliance with internal and external regulations. Once installed, the audit plugin logs client connections, disconnections, and database activity. From MySQL 8.0.30, it also records query time and size to detect anomalies.
Note: only available in MySQL Enterprise Edition.
- Releem AI-powered log monitoring
Releem monitors MySQL performance, autodetects performance issues, and provides insights on improvements, highlighting key data on latency, slog log, and errors. This tool will help you catch potential issues early and address these errors to maintain database stability.
Price: from $79 per month.
- Pt-query-digest tool
Pt-query-digest analyzes MySQL query logs, pinpointing data on query frequency, execution time, and performance metrics. It helps identify slow or inefficient queries, diagnose database issues, and track performance improvements over time.
Price: free.
- dbForge Studio for MySQL
dbForge Studio for MySQL is a powerful IDE designed to simplify MySQL database management, including slow query log analysis and an expert-level query optimization feature. It offers multiple ways to monitor and analyze query logs, helping you detect performance bottlenecks and troubleshoot issues efficiently. You can review status messages and errors directly in the Output and Error List windows or dive deeper into query performance using the Query Profiler tool.
With Query Profiler, you can analyze query execution, track workload changes, and detect slow-running queries. It automatically compares STATUS variables before and after execution in the Session Statistics tab, providing insights into performance fluctuations.
Best practices for managing MySQL logs
Use a long-term archive for slow query logs
Slow query logs are essential for diagnosing performance issues, but without proper archiving, tracing the root cause of problems can be challenging. By creating a long-term archive for slow query logs, you’ll have easy access to historical data, allowing you to quickly identify issues and their causes, as well as pick up patterns that repeat. This proactive approach can also help prevent future problems by spotting potential performance bottlenecks early.
Use the binary log optionally
The binary log records all changes to the database, including DML statements (INSERT, UPDATE, DELETE) and DDL statements (CREATE TABLE, ALTER TABLE). That’s why it’s notorious for slowing down system performance. However, if you have it enabled, you can use it for point-in-time recovery, which can save your day if the recently made changes are causing issues (e.g., the migration failed). This log can also be particularly helpful when dealing with accidental or malicious data loss.
Monitor InnoDB metrics
As MySQL’s default storage engine, InnoDB handles transactions, data integrity, and concurrency. Monitoring key metrics like buffer pool hit rate, log flush rate, and transaction commit rate helps detect potential issues before they escalate. Use monitoring tools with alerts to stay informed of any performance concerns.
Monitor MySQL system variables
System variables control MySQL’s behavior, including resource limits and feature settings. Regular monitoring helps ensure optimal performance and detects potential issues early. Track changes over time to spot misconfigurations or suspicious activity. Logging all modifications provides a clear history for troubleshooting and security audits.
Automating log rotation and maintenance
Efficient log management is key if your intention is to prevent MySQL log files from consuming excessive disk space. Automating log rotation helps keep logs organized, reduces manual intervention, and ensures smooth database performance.
How log rotation works
Log rotation involves renaming the current log file (e.g., appending a number like 1), creating a new log file for fresh entries, and incrementing the numbers of older log files. Depending on retention policies, older logs may be compressed, archived, or deleted to free up space.
However, not all logs should be rotated. So, before you start, let’s check what your considerations should be when you want to set a rule for log rotation.
| Log File Size Limit | You should define a maximum file size (e.g., 300MB) to trigger rotation. Only the logs that exceed a certain size and potentially can slow down your server should be rotated. |
| Rotation Frequency | Decide if you want to rotate logs daily, weekly, or based on size thresholds. Some projects do not require frequent rotations; this depends on the size of the logs a lot. |
| Retention Policy | Keep a set number of old logs (e.g., last 30 logs) before removal. |
Automating log rotation
There are several utilities you can use to automate log rotation. Here are some of the most common ones you can check out:
| mysqlbinlogrotate | This utility rotates the binary log by closing the active binary log file and opening a new binary log file. |
| logrotate | This utility is commonly used to automate log compression, deletion, and archiving. It can be configured to run daily, weekly, or when a log reaches a specified size. |
Managing binary logs efficiently
Binary logs track all database changes and can grow rapidly, consuming storage. Setting up automated rotation prevents disk space issues by closing old logs and creating new ones based on time intervals or size limits. This keeps logs manageable while ensuring that recent data remains accessible for replication and recovery.
Conclusion
MySQL logs are highly useful for optimizing MySQL performance and finding out the reasons for the issues connected with server failure, low latency, resource-consuming queries, and inefficient processes.
In this article, we showed how to view MySQL logs to get information about the state of the MySQL server. You have also learned the standard location of logs and are capable of enabling and disabling them when necessary. We have also provided an overview of MySQL logs viewer tools that might be helpful in detecting patterns in slow logs and error logs and will assist you in protecting your database from performance issues.
Now that you know how to see MySQL logs, feel free to use them how you see fit.
Moreover, you can use dbForge Studio for MySQL to enhance your slow queries. Try this universal multifunctional IDE for MySQL administration, development, and management, and you will for sure fall in love with it.

