
This article covers some of the most popular MySQL performance monitoring tools alongside the key performance metrics that can help improve and optimize query performance in MySQL databases.
MySQL is an open-source relational database that a lot of users prefer to utilize in their work and daily operations due to the variety of storage engines it supports, its flexibility and high performance, strong data security, cost-effectiveness, easy management, and reliability.
Why do you need to measure and monitor MySQL performance?
Guaranteeing smooth and effective database performance is one of the core aspects for any business and company no matter how large or small they are. Thus, getting a comprehensive insight into database uptime or load is critical in some situations and should be monitored on a regular basis.
For this reason, the market offers plenty of monitoring tools to track, analyze, and measure performance, and investigate its potential issues. They help you not only optimize queries but also visualize database metrics, collect statistics, and show the performance status to understand the impact on overall performance and troubleshoot possible issues.
The optimization of database performance may result in the following benefits:
- Accelerate data retrieval
- Significantly increase query performance
- Identify slow performance
- Improve user experience
- Prevent possible downtime and excessive consumption of resources
- Define the impact of database changes
- Diagnose security vulnerabilities
MySQL performance monitoring tools
The market of MySQL performance monitoring tools offers a lot of tools to analyze and optimize query performance, for example, MySQL Enterprise Monitor, MySQL Workbench, and dbForge Studio for MySQL.
MySQL Enterprise Monitor
MySQL Enterprise Monitor is a monitoring tool designed to keep track of MySQL real-time instances and hosts, alert users about possible issues, and notify them how they can be resolved. With this tool, you can optimize performance, be aware of releases and bug fixes, manage and avoid any issues or downtime. The Enterprise dashboard available in MySQL Enterprise Monitor helps you check execution statistics, search for the most expensive queries, observe InnoDB performance tuning metrics, identify security vulnerabilities, analyze queries visually, and view the metrics of the MySQL servers you’re running. Still, it should be noted that MySQL Enterprise Monitor depends on the MySQL performance schema. Thus, for correct work, it should be enabled.
MySQL Workbench
MySQL Workbench is a visual modeling tool for MySQL databases, which provides a set of features to view and improve the performance of your databases. The Performance dashboard can visualize the main performance metrics, such as incoming and outgoing network traffic, performance statistics, executed SQL statements, InnoDB status, including disk activity, writes, and reads. Besides, with performance reports, it is much easier to analyze MySQL database performance. And to fine-tune SQL query performance, you can check the explain plan.
dbForge Studio for MySQL
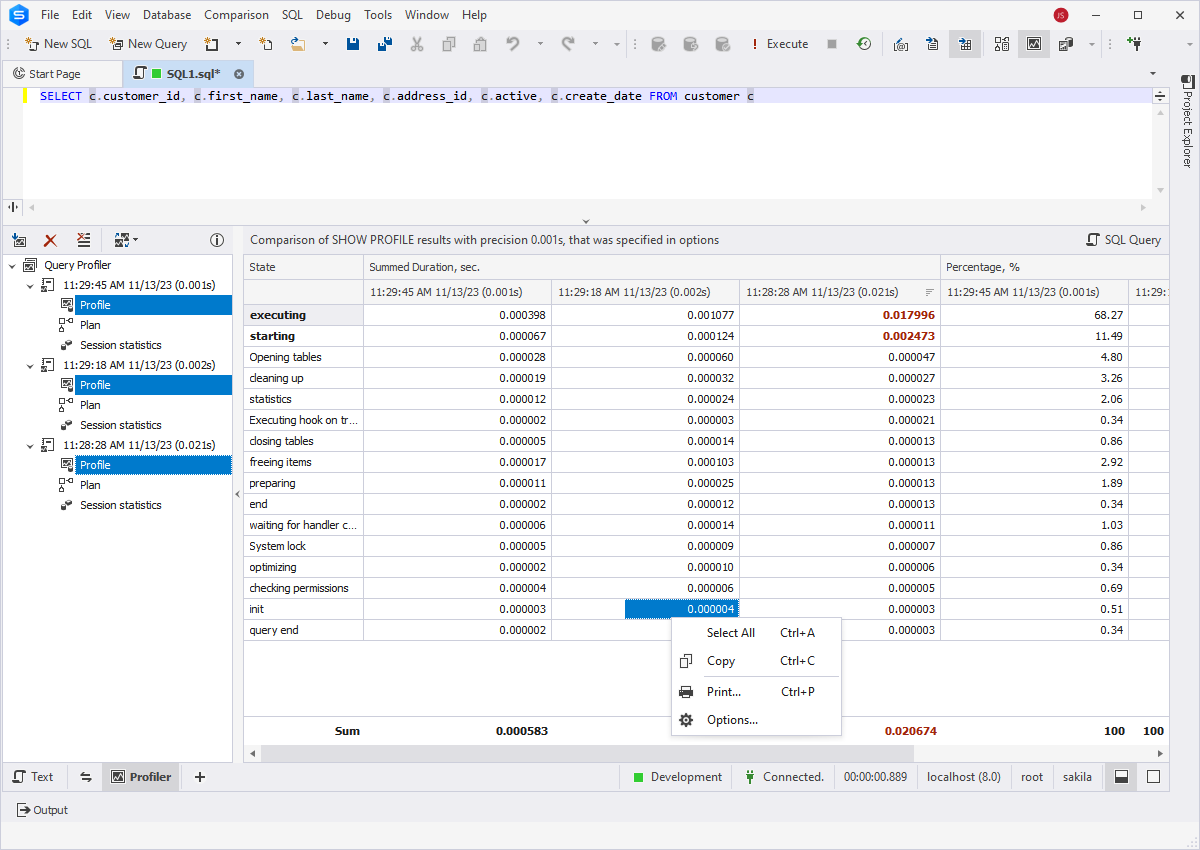
dbForge Studio for MySQL is a multifeatured IDE that delivers, among other things, a MySQL query profiling and optimization tool called Query Profiler, which helps you examine and increase query performance in MySQL and MariaDB databases. With the explain plan at hand, you can easily understand how MySQL operations are executed, how much time it will take to execute queries, whether to use indexes to have a positive influence on performance. Acting as a lightweight SQL monitor, Query Profiler collects session statistics and displays profiling results that help you investigate possible bottlenecks and resource consumption, and decide on an efficient technique for performance optimization.
It’s worth mentioning that dbForge Studio offers a rich feature set that goes far beyond query profiling. As a MySQL database management software, it supports SQL code completion and formatting, source control integration, database comparison and synchronization, database design, test data generation, visual query building, data analysis, and reporting.
See also: Feature-by-feature comparison: MySQL Workbench vs dbForge Studio for MySQL
MySQL database performance metrics
MySQL provides a bunch of useful metrics you should monitor to detect bottlenecks and analyze what queries should be optimized.
The most important database performance monitoring metrics cover the following:
- System: System resources on the server. They include CPU usage, memory usage, disk usage, network bandwidth, read/write requests, Input/Output wait statistics, average read/write time, etc.
- Query throughput: A workload of the database that can be measured as the number of queries per second. With this metric, you can analyze how your server performs and processes queries over time, as well as track the performance of specific statements (SELECT, INSERT, UPDATE, and DELETE).
- Connections: The number of open connections running simultaneously that may overload the server and slow down the performance.
- Uptime: The database startup and shutdown time on a MySQL instance.
- Threads: The number of clients currently connected.
- Response time: An average response time per query or for all queries in the database server you are connected to.
- Latency: The duration of queries or operations.
- Errors: The number of code errors that happen most frequently and cause failures.
- Queries: The number of statements most frequently executed by the server, including stored procedures.
- Questions: The number of statements sent by clients.
- Buffer pool usage: Memory usage on the server. As a rule, it is used to investigate performance issues.
Depending on the location, MySQL database performance metrics and statistics can be divided into server status variables, performance schema, and sys schema.
MySQL server stats
To collect server stats, you can use server status variables. They are internal counters at the session or global levels that you can view to get information about operations running on the MySQL server.
To view these variables, execute the SHOW [GLOBAL | SESSION] STATUS statement where GLOBAL returns aggregated values for all connections, and SESSION – values only for the current connection.
MySQL performance schema
The MySQL performance schema stores statistics about server events and query execution at a low level. Starting with MySQL v5.6.6 it is enabled by default.
MySQL displays it as the performance_schema database containing tables that you can query using SQL statements. As a result, you get information about performance that may include current events, event histories and summaries, object instances, setup data, duration of server events, status monitoring, etc.
MySQL sys schema
The MySQL sys schema includes stored procedures, views, and stored functions to interpret data collected by performance schema and to check how a MySQL instance is currently running. By default, it is enabled in MySQL v5.7.7 and later. The sys schema provides information about database usage, including current connections, queries being executed, buffer size, locks, and summarizes statement activity, I/O latency, memory usage by host and users, wait stats, resources consumed by users, etc.
How to monitor query performance
To analyze query performance and detect long-running and resource-consuming queries, you can monitor different metrics, including CPU and memory consumption, execution time, disk activity, wait stats, I/O cycles, etc.
In MySQL, you can identify and investigate slow query logs. For this, make sure that logs are enabled by running the following command:
MariaDB [(none)]> show global variables like 'slow%log%';Along with this, enable the slow_query_log_file variable defining the file to store slow query logs, long_query_time determining the execution time in real time and min_examined_row_limit, indicating the number of rows to be examined. All these variables can be used to search for queries that take a long time to execute and should be analyzed to optimize query performance.
Another way to detect slow MySQL queries is to execute the following command:
SHOW [FULL] PROCESSLIST;

-- or

SHOW ENGINE INNODB STATUS \G
They allow you to view active queries and to check the status of your query.
If you’d like to get even more effective tips to tune performance, see MySQL server performance tuning with tips for effective optimization.
Explore different MySQL log types and their best use cases along with MySQL logs viewer tools in this guide.
Conclusion
We hope our review of key database performance metrics and top tools for performance monitoring has been helpful. Still, there’s nothing like getting some firsthand experience. Thus we gladly invite you to download dbForge Studio for MySQL for a free 30-day trial to see all of its capabilities, including Query Profiler, in action.